. 2021 Aug 10;10:e64644. doi: 10.7554/eLife.64644

Figure 2. Model validation.

(A) Time course of RasGTP in response to 30 pulses at 0.5 Hz (Harvey et al., 2008). RasGTP dynamics are qualitatively consistent with experimental measurements. (B) Relative increase of ppERK in response to L-LTP stimuli (two bursts of 100 Hz for 1 s, bursts separated by 20 s) (Kasahara et al., 2001). Simulation shows qualitative match of ERK activation to the experimental model as ppERK peaks around 3 min after stimulation and returns to basal about 30 min after stimulation.

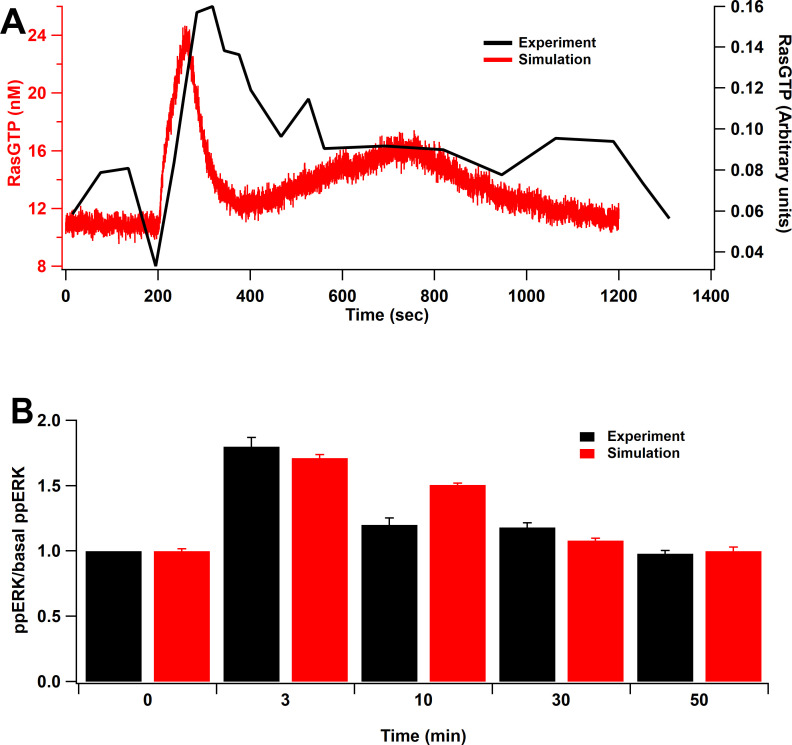
Figure 2.

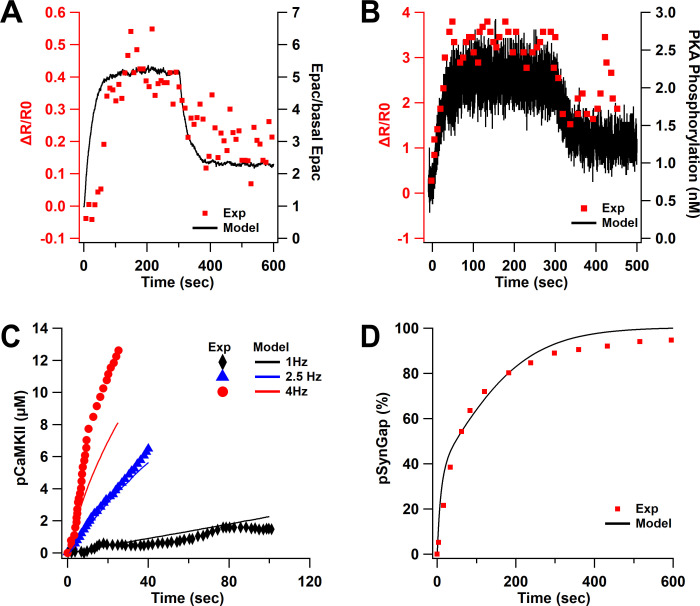
Figure 2—figure supplement 1. Model validation.

Figure 2—figure supplement 1.

(A) Epac activity in response to 1 µM ISO in the model is similar to dynamics of experimentally measured Epac fluorescence (Luczak et al., 2017). (B) Time course of PKA phosphorylation of Src in response to 1 µM ISO is similar to the PKA FRET sensor activity (Luczak et al., 2017). (C, D) Parameter optimization matches experimental data of CaMKII (De Koninck and Schulman, 1998) (C) and SynGap phosphorylation (Walkup et al., 2015) (D).