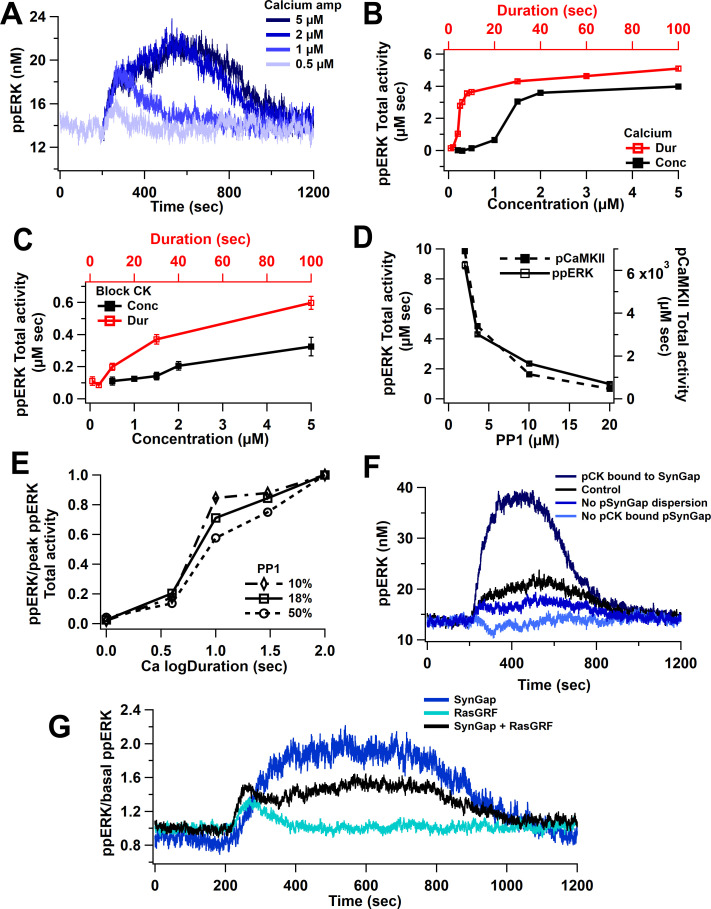
Figure 4. Nonlinear activation of ERK by calcium pathway.
(A) Time course shows a sustained ppERK when calcium is above amplitude threshold (2 μM) for 1 s duration. (B) Total ppERK activity over time in response to different calcium concentrations (for 1 s) and different calcium durations (with a concentration of 0.5 μM) reveals ultrasensitive response. (C) With CaMKII activity blocked, RasGRF is the sole calcium-activated pathway to ERK activation. ERK activation is no longer ultrasensitive. (D) pCaMKII and ppERK activities in response to 0.5 μM for 30 s of calcium decrease with increased PP1. Similar results were observed with different concentrations or duration. (E) Increasing PP1 quantity decreases the steepness of ppERK vs duration (log10) curve. (F) Total ERK activity changes with SynGap availability. Blocking dispersion of SynGAP reduces ppERK, whereas allowing CaMKII to bind but not phosphorylate SynGAP enhances ppERK. (G) Ratio of ppERK to basal ppERK in response to calcium activation of RasGRF or SynGap alone (0.5 µM calcium for 30 s), compared with control (SynGap + RasGRF).

