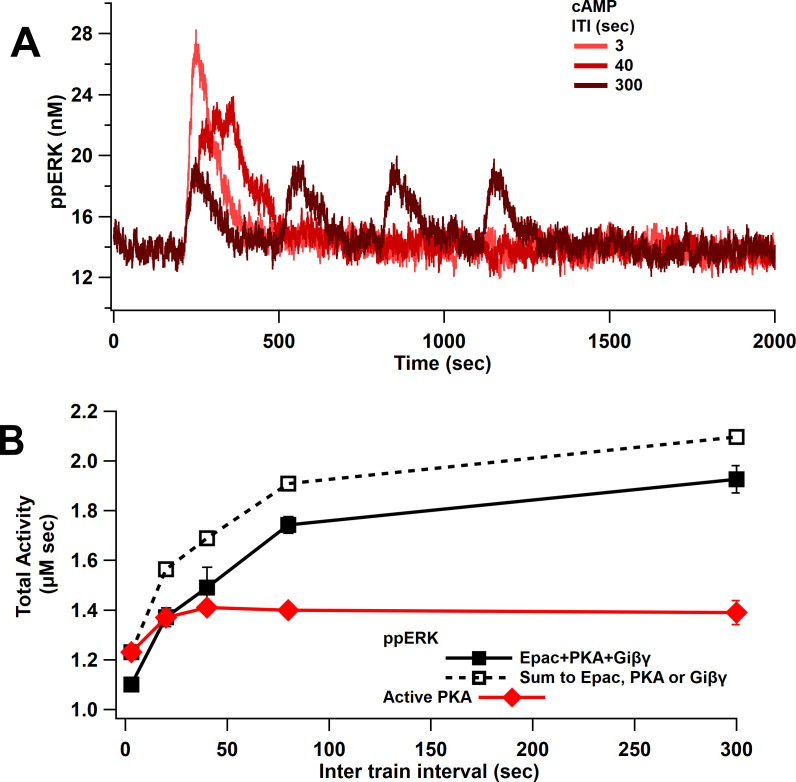
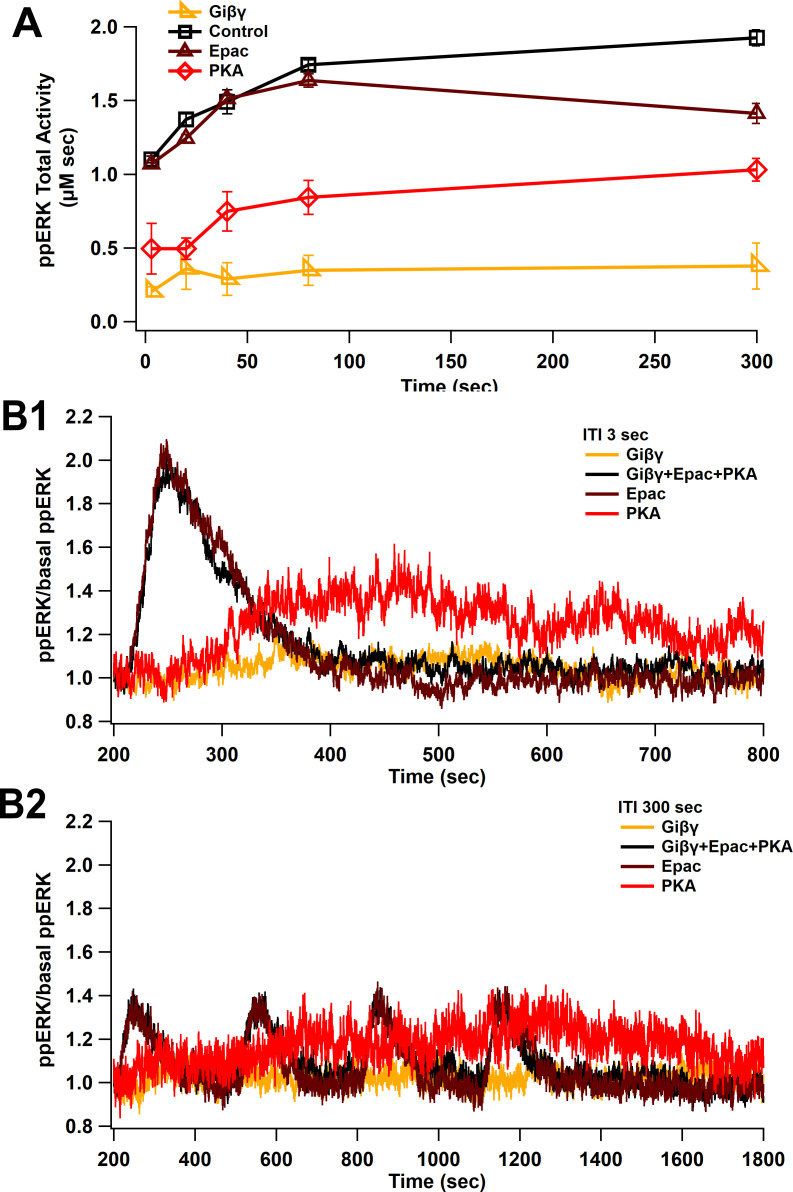
Figure 6. ppERK favors spaced stimuli in response to cAMP input.
(A) Time course of ppERK in response to 4 trains of 100 Hz stimuli of cAMP (Epac, PKA, Giβγ pathways). ppERK peak amplitude decreases with ITI, but the AUC increases with ITI. (B) Total kinase activity in response to cAMP shows that ppERK exhibits sublinear response to cAMP stimuli: the sum (dashed line) is higher than ppERK in response to combination (solid black line). PKA and ppERK have similar temporal sensitivity, favoring spaced stimuli. Two-way ANCOVA (analysis of covariance) of ppERK AUC versus stimulation characteristics (ITI) and type (combination versus summation) as factors (N = 5 in each group) is significant for both stimulation ITI and type (F (2,47) = 42.25, T < 0.0001; T(ITI) = 4.67, P(ITI) < 0.0001, T(type) = 7.92, P(type) < 0.0001).


