. 2021 Aug 10;10:e64644. doi: 10.7554/eLife.64644

Figure 8. ppERK integration of calcium and cAMP inputs can be linear or supralinear.

(A) ppERK mostly increases with temporal interval, with the greatest quantity occurring at 80 s (above calcium threshold or 18% PP1) or 300 s (below calcium threshold). Supralinear summation occurs at 18% PP1 and linear summation occurs at low calcium or high PP1 – conditions that reduce ultrasensitivity of CaMKII (Figure 3E). Supralinearity is indicated by the response to the combination of cAMP and calcium (Combo) being greater than the sum of responses to calcium and cAMP separately. ANCOVA results are in Table 5. (B) Summary of ppERK total activity in response to 300 s ITI. The contribution of the calcium pathway relative to the cAMP pathway is greatest when calcium is above threshold for an ultrasensitive CaMKII response. (C) Qualitative single pathway contribution to ppERK (ppERK from single pathway divided by ppERK from all pathways; sum of pathways exceeds 100%). The contribution of SynGap decreases with ITI, whereas other pathways increase with ITI.

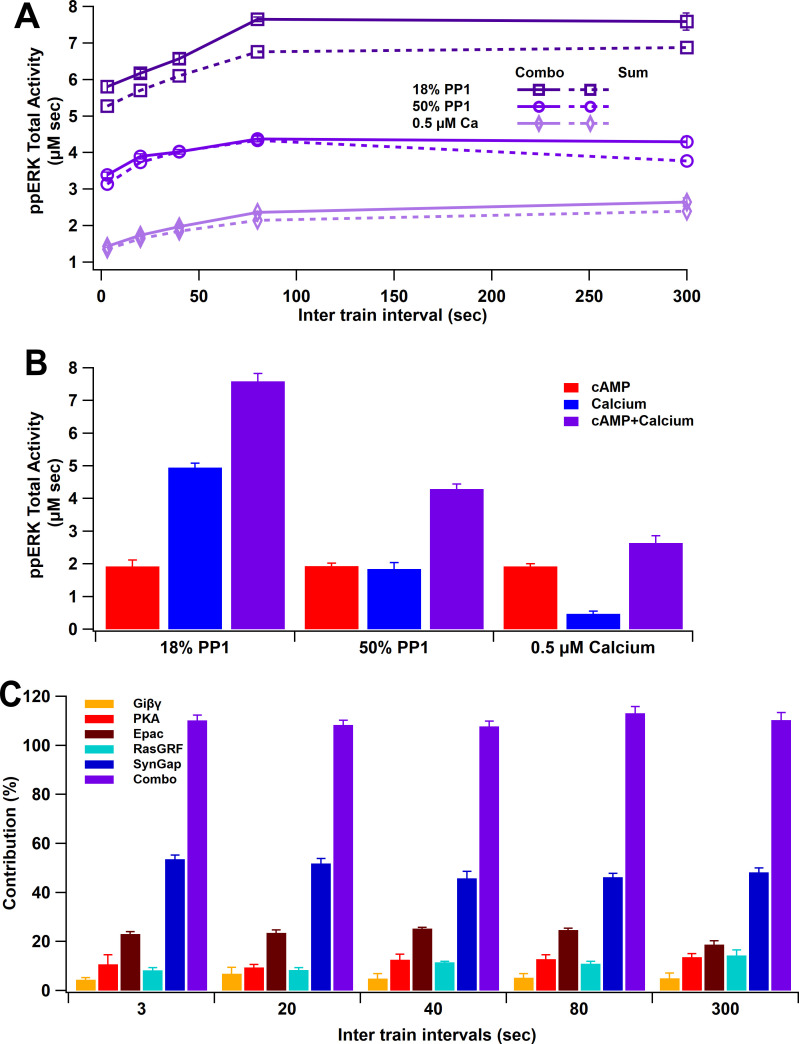
Figure 8.

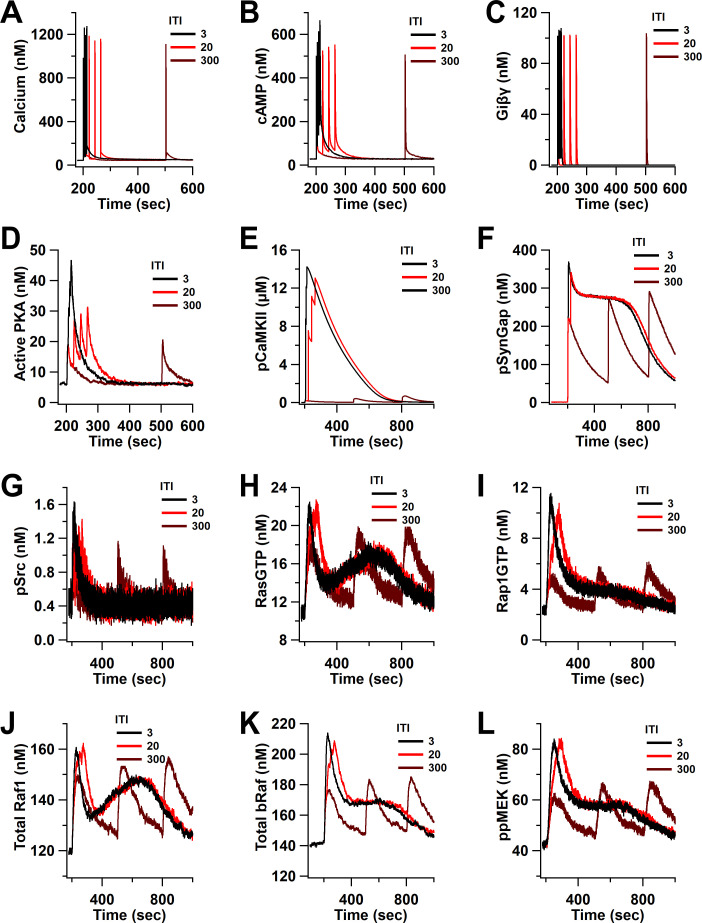
Figure 8—figure supplement 1. Time course of inputs and key molecules upstream of ERK in response to four trains separated by 3, 20, and 300 s.

Figure 8—figure supplement 1.

(A) calcium, (B) cAMP, (C) Giβγ, (D) active PKA, (E) phosphorylated CaMKII, (F) phosphorylated SynGap, (G) phosphorylated Src, (H) RasGTP, (I) Rap1GTP, (J) total active Raf1, (K) total bRaf, (L) ppMEK.
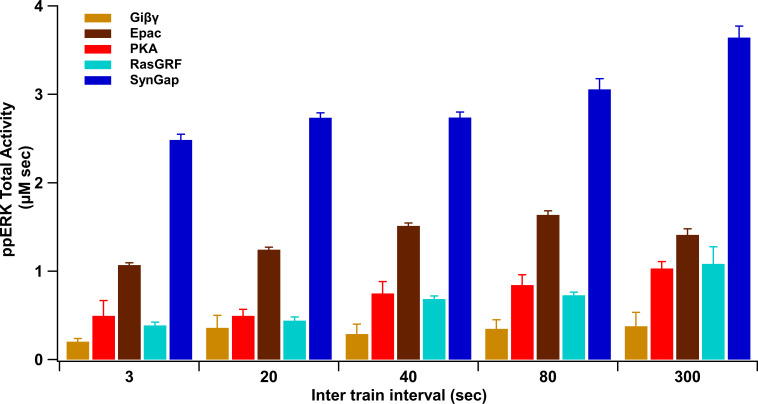
Figure 8—figure supplement 2. Summary of ppERK total activity in response to each pathway.

Figure 8—figure supplement 2.

ppERK increases with ITI for all pathways, though SynGap does not increase as sharply, reducing its relative contribution.
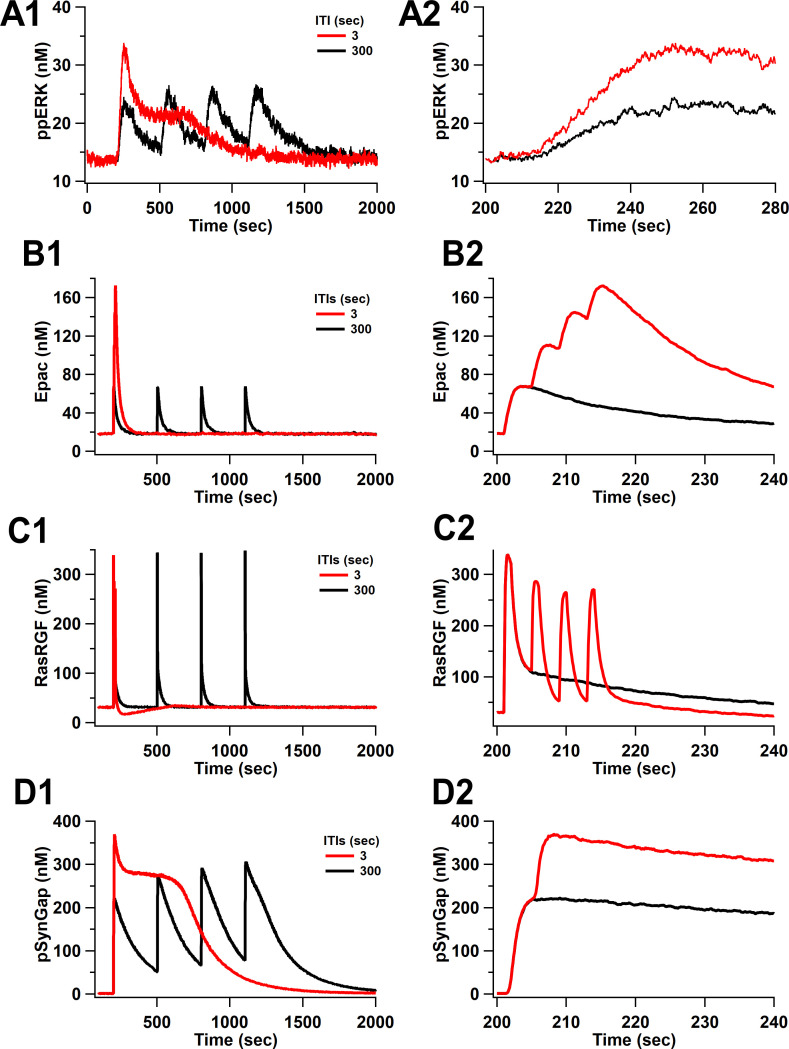
Figure 8—figure supplement 3. Time courses of ppERK and key molecules upstream of ERK in response to four trains of 100 Hz separated by 3 and 300 s.

Figure 8—figure supplement 3.

Time course of (A) ppERK, (B) active Epac, (C) active RasGRF, and (D) phosphorylated SynGap . (A2D2) represent the first 140 s after stimulation of (A1D1), respectively.
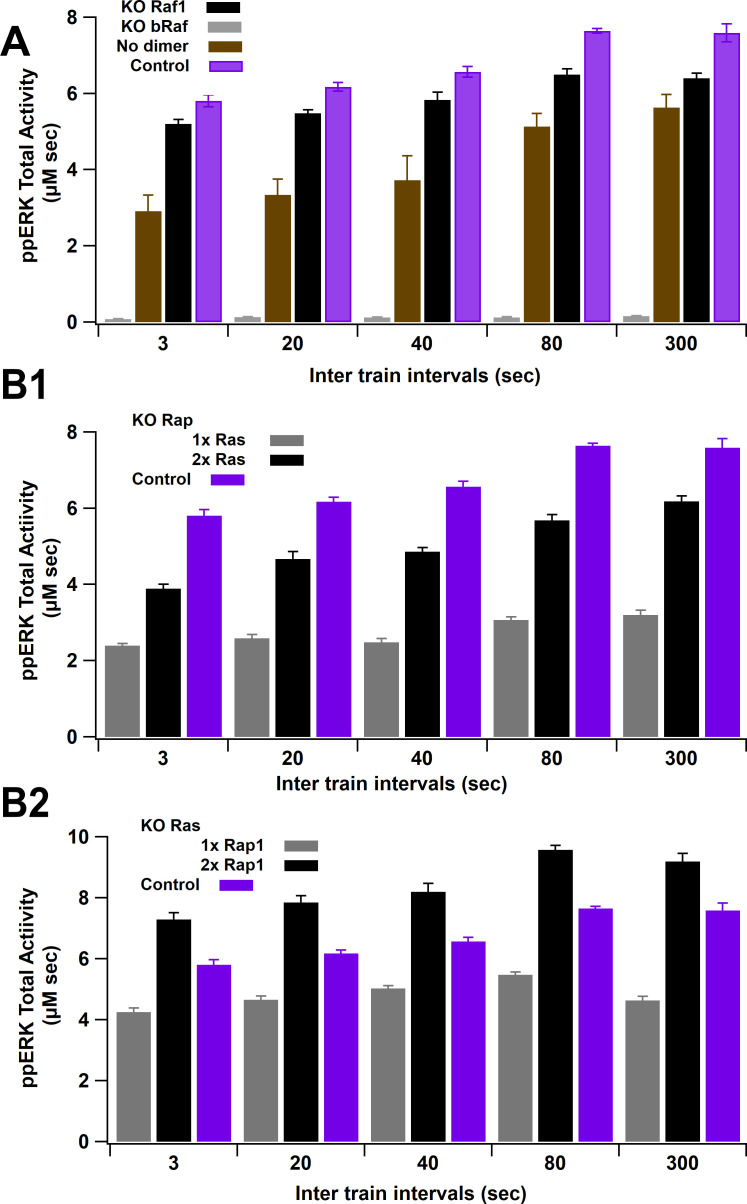
Figure 8—figure supplement 4. ERK activity versus ITI for several knockout experiments.

Figure 8—figure supplement 4.

(A) Total ppERK activity in response to L-LTP stimuli under Raf1, bRaf, or Raf1 dimerization knockout (KO). bRaf is the greatest contributor, as observed experimentally. Eliminating dimerization enhances reduces ERK activation mostly for lower intertrain intervals; thus, the enhanced activity of Raf1 dimers reduces temporal sensitivity of ppERK. (B) Total ppERK activity in response to L-LTP stimuli under Rap1 (C1) and Ras (C2) knockout. Rap1GTP is the main contributor to ppERK, as observed experimentally.