. 2021 Aug 10;10:e64644. doi: 10.7554/eLife.64644

Figure 9. ppERK predicts the occurrence of L-LTP when bath-applied ISO is followed by either 1 s of 100 Hz stimulation or 180 s of 5 Hz.

ppERK in response to isoproterenol (ISO), 1 s of 100 Hz, or 180 s of 5 Hz does not exceed 30 nM (A), whereas ppERK reaches or exceeds 35 nM in response to the combination of isoproterenol and either 100 Hz or 5 Hz stimulation (B).

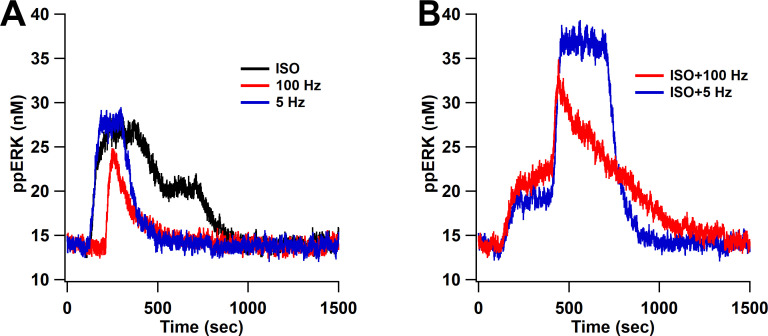
Figure 9.

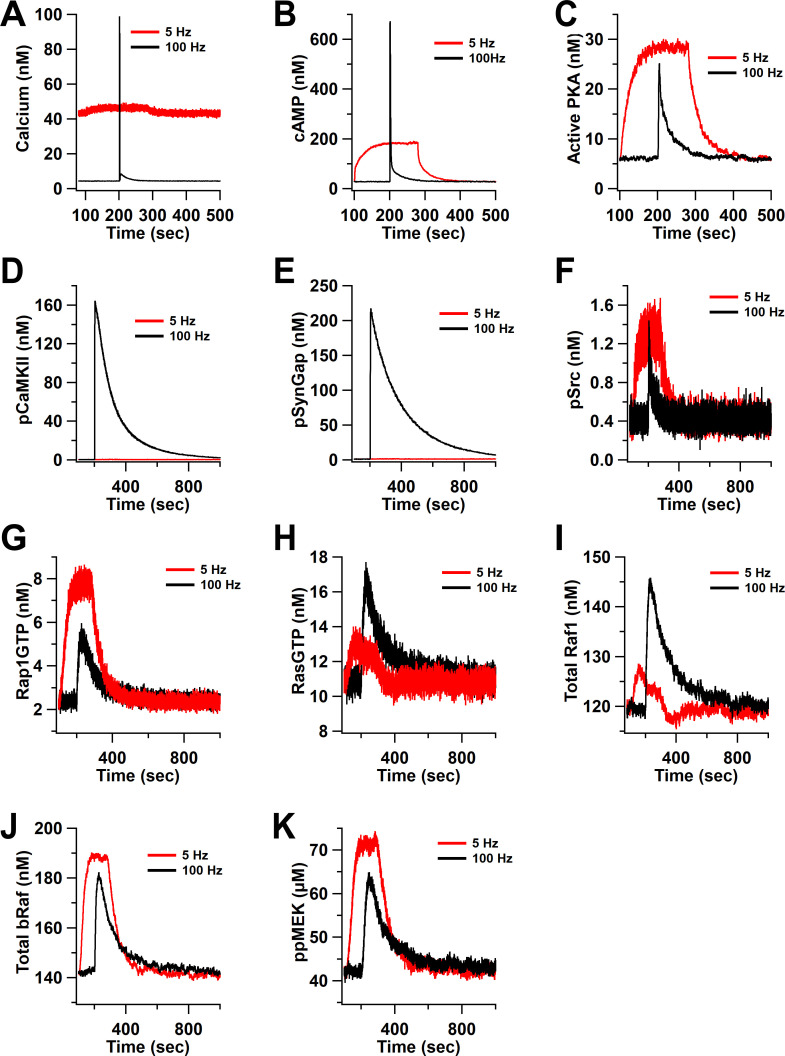
Figure 9—figure supplement 1. Time course of inputs and key molecules upstream of ERK in response to ISO followed by 100 Hz or 5 Hz stimulation.

Figure 9—figure supplement 1.

(A) calcium, (B) cAMP, (C) active PKA, (D) phosphorylated CaMKII, (E) phosphorylated SynGap, (F) phosphorylated Src, (G) RasGTP, (H) Rap1GTP, (I) total active Raf1, (J) total bRaf, (K) ppMEK .