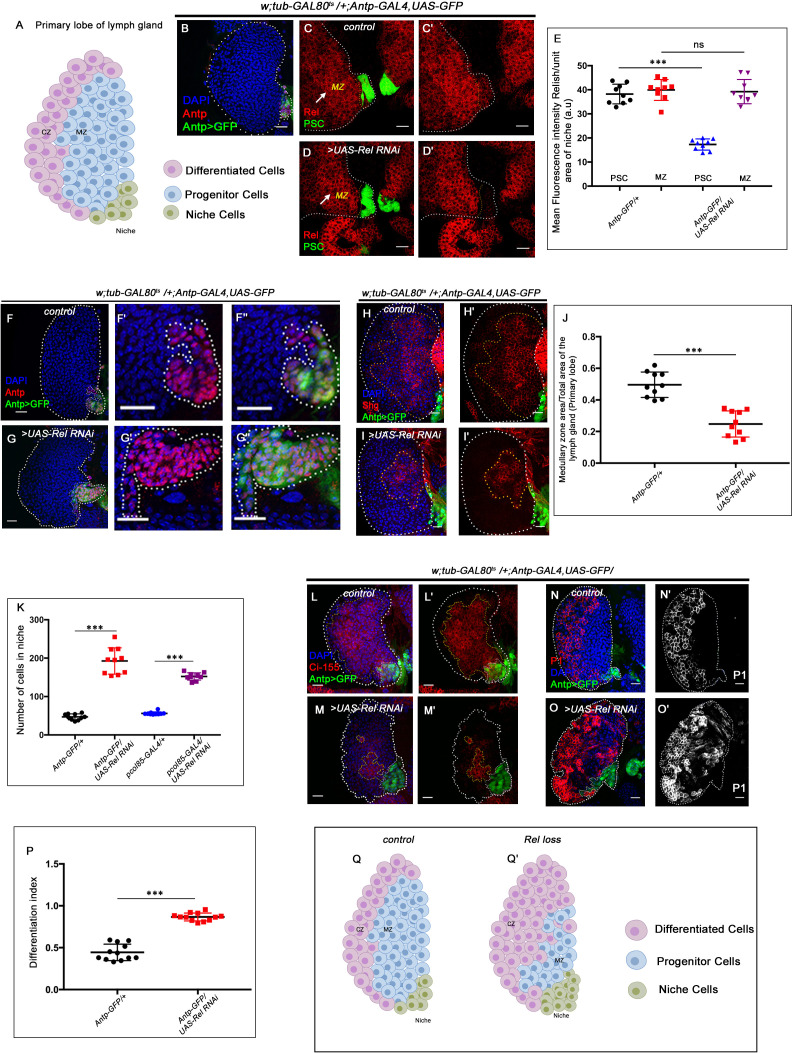
Figure 1. Relish expression and its function in hematopoietic niche of Drosophila larval lymph gland.
Genotypes are mentioned in relevant panels. Scale bar: 20 μm. (A) Schematic representation of Drosophila larval lymph gland with its different cell types. (B) Hematopoietic niche in larval lymph gland visualized by Antp-Gal4,UAS-GFP and Antennapedia (Antp) antibody. (C–D') Expression of Relish (antibody: red) in larval lymph gland. (C) Relish is expressed in the hematopoietic niche of lymph gland and in the progenitor population. (C') Zoomed in view of the niche showing the expression of Relish in control niche. (D–D') Relish expression is abrogated in the niche upon RNAi mediated downregulation. (E) Quantitation of Relish expression in the niche. Significant reduction in Relish expression was observed in niche (n=10, p-value=7.4 × 10⁻⁹, two-tailed unpaired Student’s t-test), whereas progenitor-specific expression remained unchanged (n=10, p-value=0.764 , two-tailed unpaired Student’s t-test). (F–G'') Effect of Relish loss from the niche on cell proliferation (F–F''), Antp expression marks the niche of wild-type lymph gland. (G–G'') Loss of Relish function from niche leads to increase in niche cell number. (H–I') Hematopoietic progenitors of larval lymph gland (red, reported by DE-Cadherin [Shg] immunostaining). Compared to control (H–H'), drastic reduction in progenitor pool was observed when Relish function was attenuated from niche (I–I'). (J) Quantitation of Shg-positive progenitor population upon Relish knockdown from the niche using Antp-GAL4 (n=10, p-value=8.47 × 10⁻⁶, two-tailed unpaired Student’s t-test). (K) Quantitation of niche cell number upon Relish knockdown from the niche using Antp-GAL4 (n=10, p-value=1.3 × 10⁻⁷, two-tailed unpaired Student’s t-test) and pcol85-GAL4 (n=11, p-value=1.2 × 10⁻¹², two-tailed unpaired Student’s t-test). (L–M') Hematopoietic progenitors of larval lymph gland (red, reported by Ci155 immunostaining) (L–L'). Loss of Relish from the niche resulted in reduction in Ci155-positive progenitor pool (M–M'). (N–O') Compared to control (N–N'), increase in the amount of differentiated cell population (red, P1 immunostaining) was observed upon niche-specific downregulation of Relish (O–O'). (P) Quantitative analysis of (N–O') reveals significant increase in the amount of differentiated cells in comparison to control (n=10, p-value=2.3 × 10⁻⁹, two-tailed unpaired Student’s t-test). (Q–Q') Scheme based on our observation. The white dotted line mark whole of the lymph gland in all cases and niche in (F–G''). Yellow dotted lines mark the progenitor zone in (H–I') and (L–M'). In all panels, age of the larvae is 96 hr AEH. The nuclei are marked with DAPI (blue). Error bar: standard deviation (SD). Individual dots represent biological replicates. Data are mean ± SD. *p<0.05, **p<0.01, and ***p<0.001.


