. 2021 Jul 22;10:e67158. doi: 10.7554/eLife.67158

Figure 5. Loss of Relish from the niche activated JNK causing niche hyperplasia.

The genotypes are mentioned in relevant panels. Scale bar: 20 μm. (A–B') Upregulation of JNK signaling visualized by its reporter TRE-GFP (green) in Relish knockdown (B–B') compared with WT niche (A–A'). (C) Statistical analysis of fluorescence intensity (A–B') revealed a significant increase in TRE-GFP levels compared to control (n=15, p-value=4.2 × 10−19, two-tailed Student’s t-test). (D–G') Upon niche-specific simultaneous knockdown of Rel and JNK, the niche hyperplasia observed upon loss of Relish (E–E') is rescued (G–G') and is comparable to control (D–D') whereas loss of bsk from the niche does not alter niche cell number (F–F'). (H) Statistical analysis of the data in (D–G') (n=10, p-value=5.6 × 10−8 for control versus Rel RNAi, p-value=8.0 × 10−7 for bsk DN; Rel RNAi versus Rel RNAi, p-value=0.10 control versus for bsk DN; two-tailed unpaired Student's t-test). (I–N) Cellular filopodia from the niche cells in Rel loss of function is found to be smaller in length and fewer in numbers (J and M–N). Simultaneous loss of both JNK using bsk DN and Relish (L and M–N) rescued the stunted, scanty filopodia to control state (I and M–N), whereas loss of JNK did not affect filopodia formation (K and M–N). (M–N) Statistical analysis of the data in (I–L) (Filopodia number: n=10, p=6.96 × 10−8 for control versus Rel RNAi, p-value=8.11 × 10−7 for bsk DN; Rel RNAi versus Rel RNAi, p-value=0.153 for bsk DN versus control. Filopodia length: n=6, p-value=2.78 × 10−16 for control versus Rel RNAi, p-value=1.84 × 10−6 for bsk DN; Rel RNAi versus Rel RNAi, p-value=0.22 for bsk DN vs control; two-tailed unpaired Student’s t-test). (O–R) Knocking down JNK function from the niche did not have any effect on progenitors (visualized by Shg) (Q). Downregulating bsk function in Rel loss genetic background was able to restore the reduction in prohemocyte pool (R) observed in Relish loss (P) scenario in comparison to control (O). (S) Statistical analysis of the data in (O–R) (n=10, p-value=2.26 × 10−6 for control versus Rel RNAi, p-value=1.94 × 10−7 for bsk DN; Rel RNAi versus Rel RNAi, p-value=0.521 for control versus bsk DN; two-tailed unpaired Student's t-test) The white dotted line marks whole of the lymph gland in all cases and niches in (A–G'). Yellow dotted lines mark the progenitor zone in (O–R). In all panels, age of the larvae is 96 hr AEH. The nuclei are marked with DAPI (blue). Individual dots represent biological replicates. Error bar: standard deviation (SD). Data are mean ± SD. *p<0.05, **p<0.01, and ***p<0.001.

Figure 5.

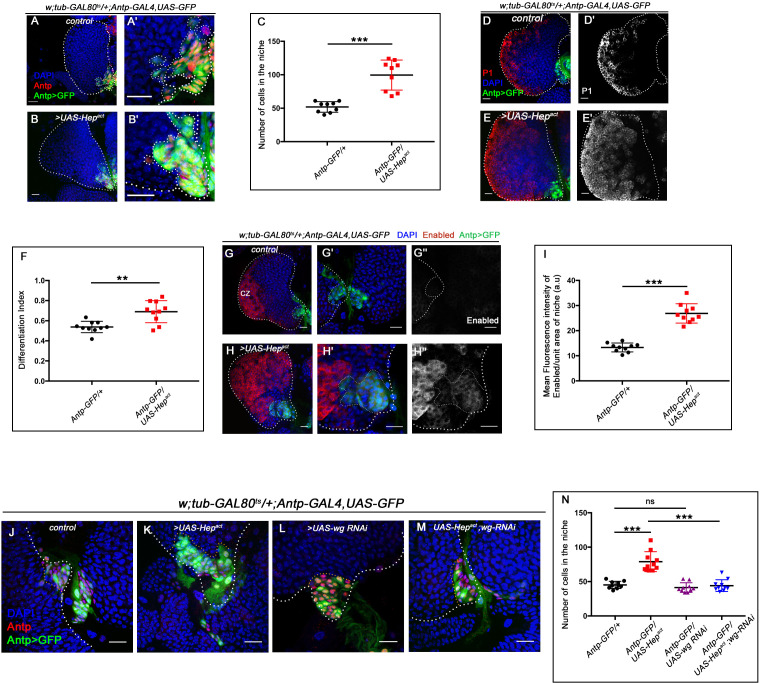
Figure 5—figure supplement 1. Ectopic activation of JNK signaling in the niche affects niche cell proliferation and progenitor maintenance.

Figure 5—figure supplement 1.

The genotypes are mentioned in relevant panels. Scale bar: 20 μm. (A–B') An increase in niche cell numbers observed upon upregulating JNK signaling using Hepact in the niche (B–B') compared to control (A–A'). (C) Statistical analysis of the data in (A–B') (n=10; p-value=2.2 × 10−4 for control versus Hepact, two-tailed unpaired Student’s t-test). (D–E') A significant increase in differentiation observed upon JNK overexpression using Hepact in the niche (E–E') compared to control (D–D'). (F) Statistical analysis of the data in (D–E') (n=10, p-value=1.7 × 10−3 for control versus Hepact, two-tailed unpaired Student's t-test.) (G–H'') Robust increase in Enabled expression is observed when in Hepact (H–H'') compared to control (G–G''). (I) Statistical analysis of the data in (G–H'') (n=10; p-value=2.1 × 10−7 for control versus Hepact, two-tailed unpaired Student's t-test). (J–M) Increase in niche cell numbers observed upon overexpressing Hep in the niche (K) is rescued to control levels (J) in a simultaneous loss of both Hep and wingless function from the niche (M). Loss of wingless using wg RNAi had milder effect on niche cell number compared to control (compare L and J). (N) Statistical analysis of the data in (J–M) (n=10; p-value=2.20 × 10−5 for control versus Hepact, p-value=1.08 × 10−5 for Hepact versus Hepact; wg RNAi, p-value=0.178 for control versus wg RNAi; two-tailed unpaired Student's t-test). The white dotted line mark whole of the lymph gland in all cases and the niches in (A–B' and G'– H'' and J–M). In all panels age of the larvae is 96 hr AEH. The nuclei are marked with DAPI (Blue). Individual dots represent biological replicates. Error bar: standard deviation (SD). Data are mean ± SD. *p<0.05, **p<0.01, and ***p<0.001.
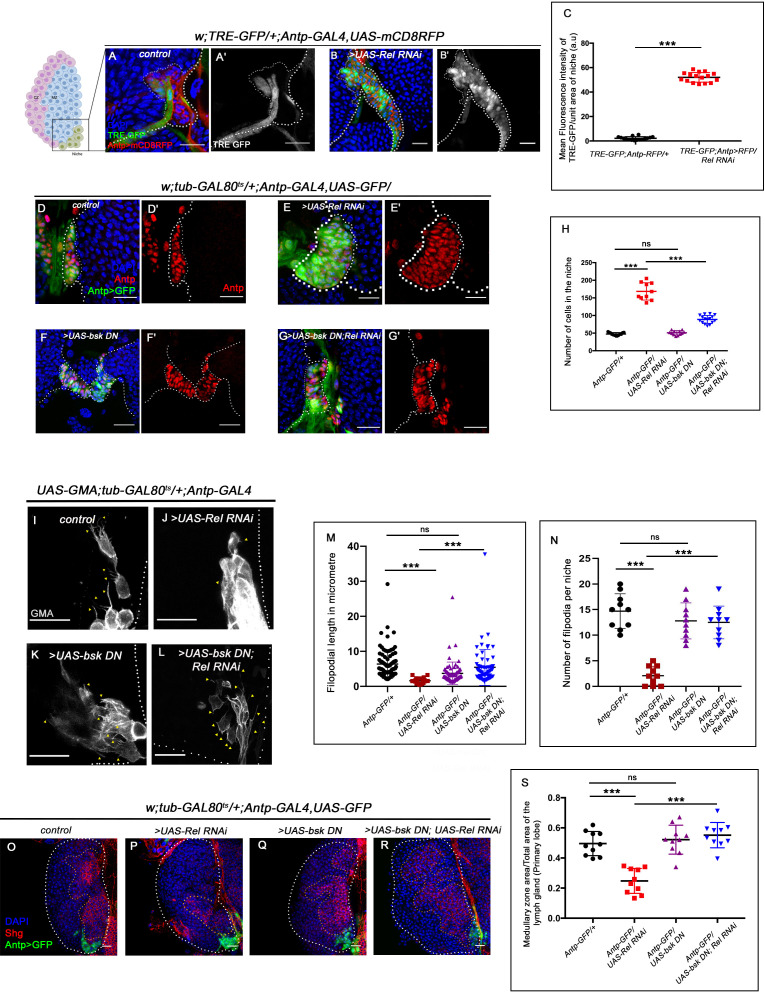
Figure 5—figure supplement 2. Downregulating JNK in Relish loss genetic background rescues progenitor loss and precocious differentiation.

Figure 5—figure supplement 2.

The genotypes are mentioned in relevant panels. Scale bar: 20 μm. (A–D) Differentiation defect observed in Relish loss (B) was reverted to control (A) in a simultaneous knockdown of both Relish and JNK (D) from the niche. Loss of JNK alone from the niche had no significant effect on differentiation (C). (E) Statistical analysis of the data in (A–D) (n = 10, p-value=1.5 × 10−9 for control versus Rel RNAi, p-value=1.79 × 10−8 for bsk DN; Rel RNAi versus Rel RNAi, p-value=0.392 for bsk DN versus control; two-tailed unpaired Student's t-test). (F–H') Reduced Extracellular Hh observed in the progenitors (HhExt) of Relish loss of function condition (G–G') in comparison to those of control (F–F'), is significantly rescued in simultaneous loss of both Rel and JNK from the niche (H–H'). The yellow box in (F', G', and H') denotes the area quantified in (I, J, and K) respectively. (I–K) The intensity profile of HhExtra in progenitors (along the rectangle drawn from niche to Cortical zone housing differentiated cells in F', G', and H') reflects a stark decline in the level of HhExtr in Rel loss scenario (J) compared to control (I) which is rescued upon simultaneous loss of both Rel and JNK from the niche (K). The white dotted line mark whole of the lymph gland in all cases. Yellow dotted line indicates the boundary between CZ and MZ in (A)–(D). In all panels, age of the larvae is 96 hr AEH. The nuclei are marked with DAPI (blue). Individual dots represent biological replicates. Error bar: SD. Data are mean ± (SD). *p<0.05, **p<0.01, and ***p<0.001.
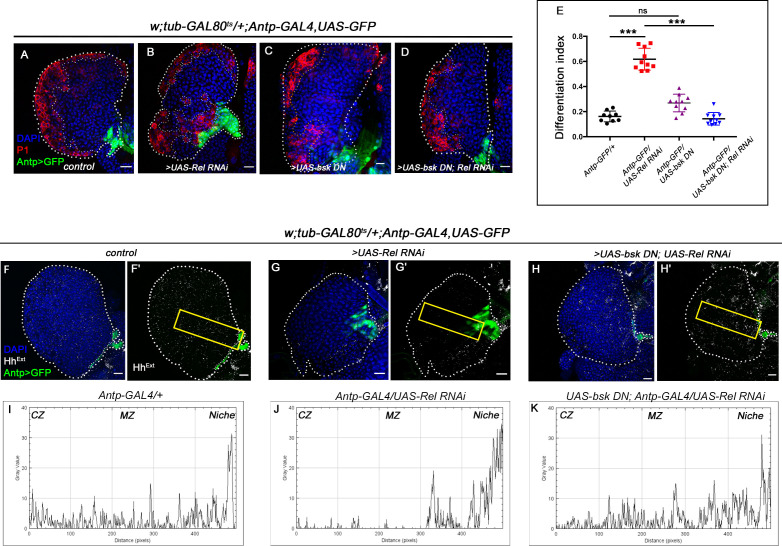
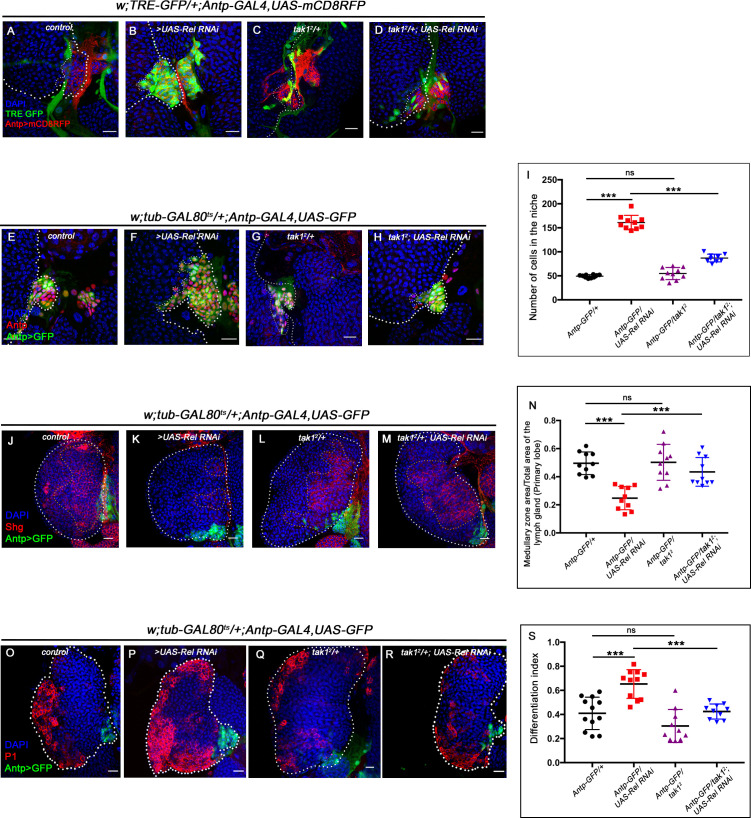
Figure 5—figure supplement 3. Relish inhibits JNK signaling by restricting tak1 activity in the niche during development.

Figure 5—figure supplement 3.

The genotypes are mentioned in relevant panels. Scale bar: 20 μm. (A–D) Up regulation of JNK signaling visualized by its reporter TRE-GFP (green) in Rel knockdown (B) compared with WT niche (A) is rescued in simultaneous loss of both the function of tak1 and Rel (D) whereas JNK activation was not observed in tak1 loss (C). (E–H) Increase in niche cell numbers observed upon loss of Rel from the niche (F) is rescued to control levels (E) in a simultaneous loss of both Rel and tak1 function from the niche (H) whereas no significant change in niche cell number was observed in tak1 loss (G). (I) Statistical analysis of the data in (E–H) (n=10, p-value=6.9×10⁻¹⁰ for control versus Rel RNAi, p-value=1.9×10⁻⁹ for tak12; Rel RNAi versus Rel RNAi, p-value=0.201 for control versus tak12; two-tailed unpaired Student's t-test). (J–M) Loss of tak1 function from the niche did not have any effect on progenitors (Shg) (L). Downregulating tak1 function in Rel loss genetic background could restore the reduction in prohemocyte pool (M) observed in Relish loss (K) scenario in comparison to control (J). (N) Statistical analysis of the data in (J–M) (n = 10, p-value=2.26×10⁻⁶ for control versus Rel RNAi, p-value = 3.1×10⁻⁴ for tak12; Rel RNAi versus Rel RNAi, p-value=0.891 for control versus tak12; two-tailed unpaired Student's t-test). (O–R) Differentiation defects observed in Rel loss (P) was comparable to control (O) in simultaneous loss of both Rel and tak1 function (R) from the niche. No significant change in differentiation was observed in tak1 loss from the niche (Q). (S) Statistical analysis of the data in (O–R) (n=10; p-value=1.5×10⁻⁴ for control versus Relish RNAi, p-value = 4.7×10⁻⁵ for; Rel RNAi versus tak12; Rel RNAi, p-value=0.115 for control versus tak12; two-tailed unpaired Student’s t-test). The white dotted line mark whole of the lymph gland in all cases and niches in (A–D and E–H). Yellow dotted lines marks the progenitor zone in (J–M). In all panels, age of the larvae is 96 hr AEH. The nuclei are marked with DAPI (blue). Individual dots represent biological replicates. Error bar: standard deviation (SD). Data are mean ± SD. *p<0.05, **p<0.01, and ***p<0.001.