. 2021 Jul 22;10:e67158. doi: 10.7554/eLife.67158

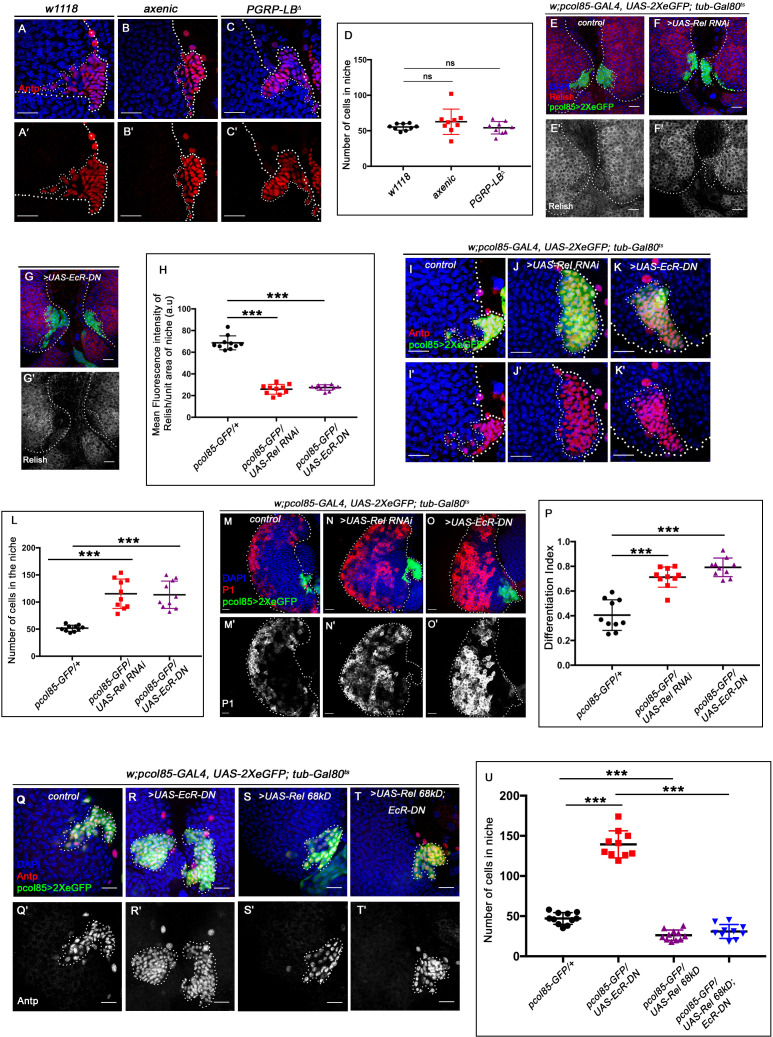
Figure 6. Ecdysone regulates Relish expression and functionality in the niche.

The genotypes are mentioned in relevant panels. Scale bar: 20 μm. (A–C') Niche number remains comparable to control (A–A') both in axenic larval lymph gland (B–B') and in PGRP-LB mutant where there is upregulation in systemic peptidoglycan levels (C–C'). (D) Statistical analysis of the data in (A–C') (n=9; p-value = 0.262 for control versus germ free and 0.392 for control versus PGRP-LB mutant; two-tailed unpaired Student's t-test). (E–G') Compared to that of control (E–E') Rel expression is significantly downregulated both in EcR loss (G–G') as well as in Rel loss from the niche (F–F'). (H) Statistical analysis of the data in (E–G') (n=10, p-value=7.81 × 10−12 for control versus Rel RNAi loss and p-value = 3.76 × 10−10 for control versus EcR-DN; two-tailed unpaired Student's t-test). (I–K') Similar to Rel loss from the niche (J–J'), EcR loss also results in increase in niche cell numbers (K–K') compared to that of control (I–I'). (L) Statistical analysis of the data in I-K' (n=10, p-value=6.6 × 10−5 for control versus EcR-DN and p-value = 3.1x10⁻⁵ for control versus Rel RNAi; two-tailed unpaired Student’s t-test). (M–O') Compared to control (M–M'), both loss of Rel (N–N') and EcR (O–O') from the niche results in increase in differentiation. (P) Statistical analysis of the data in (M–O') (n=10, p-value=4.3 × 10−5 for control versus Rel RNAi and p-value=2.2 × 10−6 for control versus EcR-DN; two-tailed unpaired Student’s t-test). (Q–T') Increase in niche cell numbers observed upon EcR loss from the niche (R–R') is rescued to control levels (Q–Q') when Relish was overexpressed in an EcR loss genetic background (T–T'). Overexpression of Relish in the niche reduced the cell number compared to control (compare S–S' and Q–Q'). (U) Statistical analysis of the data in (Q–T') (n=10; p-value=1.7×10⁻⁹ for control versus EcR-DN, p-value=7.8 × 10−11 for Ecr-DN versus UAS-Rel 68kD; EcR-DN, p-value=3.63 × 10−6 for control versus UAS-Rel 68kD; two-tailed unpaired Student’s t-test). The white dotted line marks whole of the lymph gland and niches in all the cases. In all panels, age of the larvae is 96 hr AEH. The nuclei are marked with DAPI (blue). Individual dots represent biological replicates. Error bar: standard deviation (SD). Data are mean ± SD. *p<0.05, **p<0.01, and ***p<0.001.

Figure 6.

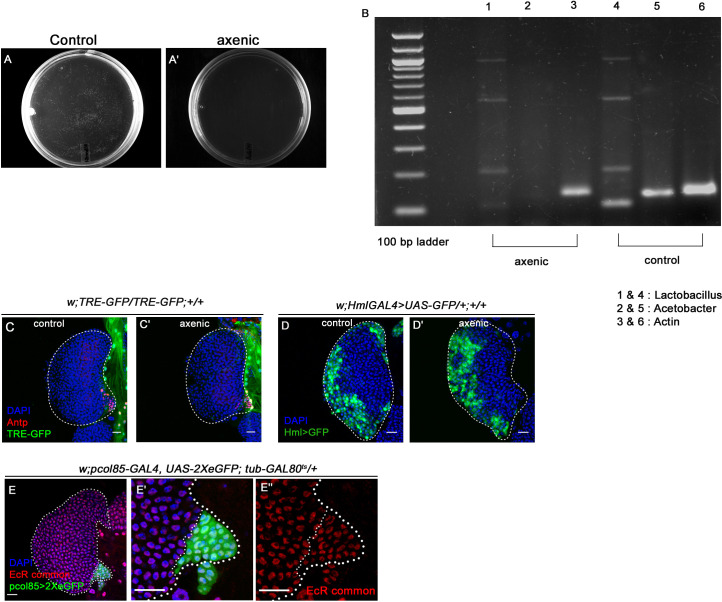
Figure 6—figure supplement 1. Ecdysone signaling is active in the hematopoietic niche.

Figure 6—figure supplement 1.

Genotypes of the larvae are mentioned in respective panels. Scale bar: 20 µm (A–A') Larval homogenates were spread on LB Agar plates to check the presence of commensal gut microbiota. In control scenario (A) bacterial colonies were visible post incubation whereas in axenic condition no growth was observed on the plates (A'). (B) The efficacy of removal of gut microflora was further checked by performing PCR analysis on DNA isolated from larval guts using 16S rDNA primers. Drosophila actin was used as control. Significant reduction in the amount of both Lactobacillus (compare lane 1 (axenic) with 4 (control)) and Acetobacter (compare lane 2 [axenic] with 5 [control]) species was observed in axenic condition compared to control scenario (compare lane 3 [axenic] and 6 [control]). (C–C') TRE-GFP expression in the hematopoietic niche (visualized by Antp, red) in axenic condition (C') is comparable to that of control (C). (D–D') Differentiation status (visualized by Hml>GFP, pan plasmatocyte marker) in axenic condition (D’) is comparable to control (D). (E–E'') Nuclear expression of Ecdysone receptor (red, EcR common) in the hematopoietic niche (green). The white dotted line marks whole of the lymph gland and the niches in (E–E''). In all panels, age of the larvae is 96 hr AEH. The nuclei are marked with DAPI (blue).
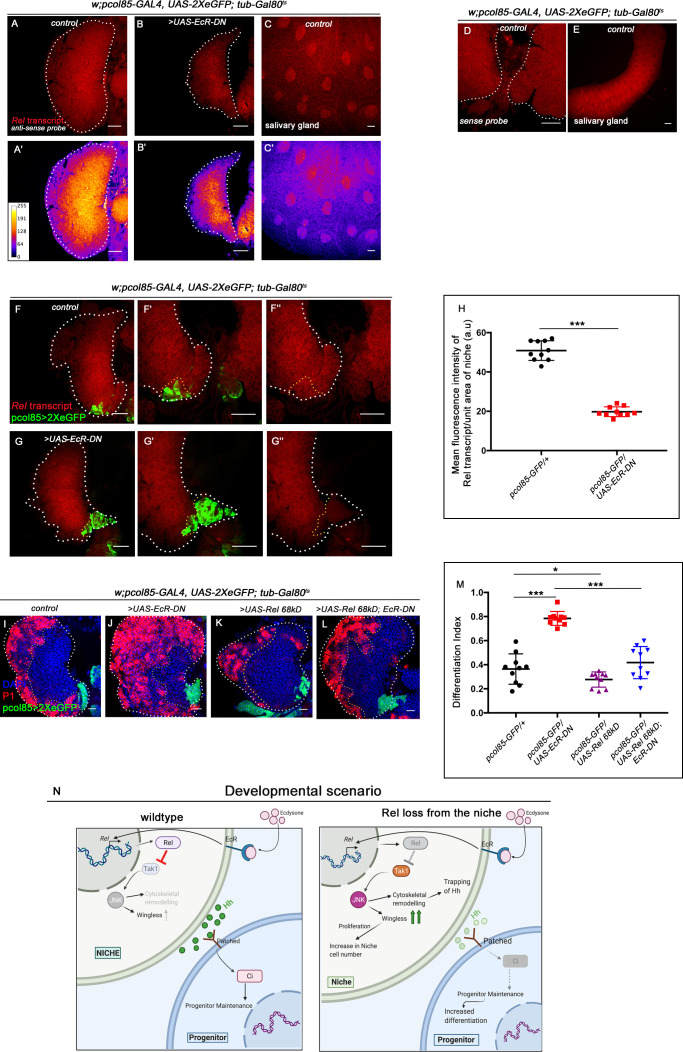
Figure 6—figure supplement 2. Relish expression is transcriptionally regulated by ecdysone signaling in the hematopoietic niche.

Figure 6—figure supplement 2.

Genotypes of the larvae are mentioned in respective panels. Scale bar: 20 µm (A–C') Fluorescent in situ hybridization (FISH) analysis showing the expression of Rel transcript in the lymph gland of the control larvae (A–A'). Loss of EcR from the niche resulted in loss of Re-positive progenitors (B–B'). Rel transcripts were also detected in salivary gland of the control larvae (C–C'). (D–E) Sense probe (negative control) showing nonspecific background expression in the control lymph gland (D) and salivary gland (E). (F–G'') Whole-mount immunofluorescence (IF) and FISH on third-instar lymph gland. Compared to control (F–F''), drastic reduction of the Rel transcript was observed in the niche from where EcR levels were downregulated (G–G''). Please note the smaller size of the LG in G–G' reflects the peeling off of the cortical zone due to excessive differentiation around 96 hr AEH in EcR loss from the niche. The increased differentiation renders fragility to the LG, which is unable to withstand harsh in situ process. (H) Statistical analysis of the data in (F'–G'') (n=10, p-value=1.56 x 10−10 for control versus EcR-DN; two-tailed unpaired Student’s t-test). (I–L) Differentiation defects observed in EcR loss (J) was reverted to control (I) when Relish was overexpressed in EcR loss genetic background (L). Slight decrease in differentiation of progenitors were observed upon Relish overexpression in the niche (compare I and K). (M) Statistical analysis of the data in (I–L) (n=10; p=3.8 × 10−7 for control versus EcR-DN, p=3.3 × 10−6 for Ecr-DN versus UAS-Rel 68kD; EcR-DN, p=7.2 × 10−2 for control versus UAS-Rel 68kD; two-tailed unpaired Student's t-test). (N) Model depicting the developmental role of Relish in hematopoietic niche maintenance. Downregulation of Relish affects the proliferation and primary function of the niche by upregulated JNK signaling. Upregulated JNK disturbs niche homeostasis through wingless and cytoskeletal remodeling, thereby affecting progenitor maintenance. The white dotted line mark whole of the lymph gland in all cases. Yellow dotted line marks the niche in (F–G'') and the boundary between CZ and MZ in (I–L). In all panels, age of the larvae is 96 hr AEH. The nuclei are marked with DAPI (blue). Individual dots represent biological replicates. Error bar: standard deviation (SD). Data are mean ± SD. *p<0.05, **p<0.01, and ***p<0.001.