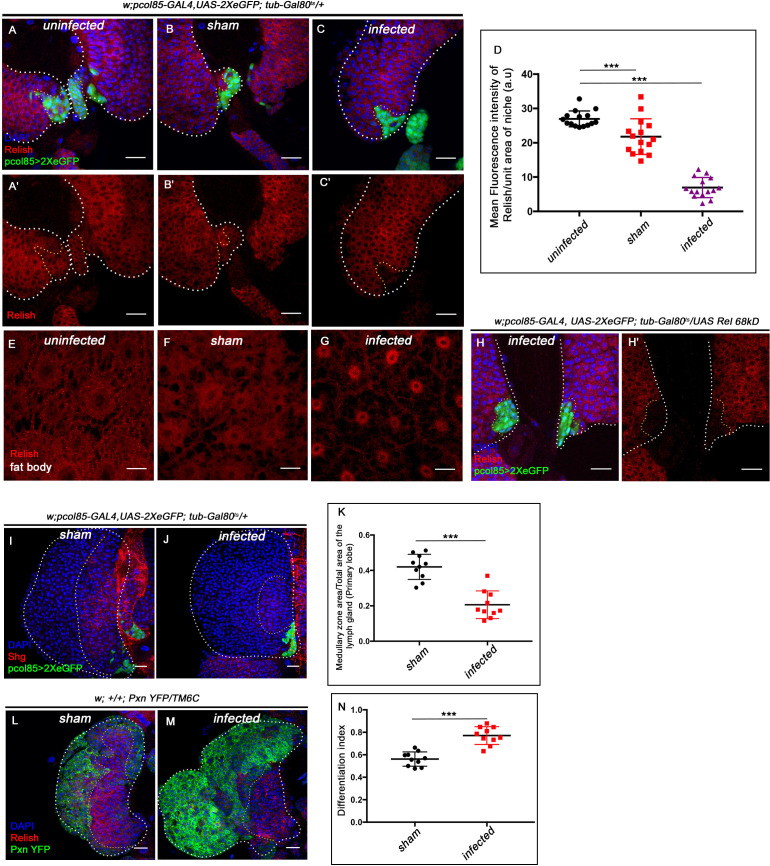
Figure 7. Niche-specific expression and function of Relish is susceptible to pathophysiological state of the organism.
The genotypes are mentioned in relevant panels. Scale bar: 20 μm. (A–C') Compare to uninfected conditions (A–A') and sham (B–B'), significant reduction in Relish expression was observed in the hematopoietic niche 4 hr post-infection (C–C'). (D) Statistical analysis of the data in (A–C') (n=15; p=6.62×10⁻¹⁸ for unpricked versus infected, p=2.5×10⁻⁷ for sham versus infected, two-tailed unpaired Student’s t-test). (E–G) Nuclear expression of Relish was observed in infected (G) fat body cells 4 hr post in contrast to uninfected (E) and sham (F) larval fat body. (H–H') Overexpressing Relish N-terminus (UAS-Rel-68kD) could not rescue loss of Relish expression post-infection. (I–J) Compared to sham (I), significant reduction in Shg-positive progenitors (red) were observed in infected lymph glands (J). (K) Statistical analysis of the data in (I–J) (n=10; p-value=5.2 × 10⁻⁶ for sham versus infected, two-tailed unpaired Student's t-test). (L–M) Drastic increase in differentiation (visualized by Pxn-YFP, green) was observed in infected lymph glands (M) compared to sham (L). (N) Statistical analysis of the data in (L-M) (n=10; p-value = 4.65×10⁻⁶ for sham versus infected, two-tailed unpaired Student's t-test). The white dotted line mark whole of the lymph gland in all cases. Yellow dotted line marks the niche in (A– C' and H–H') and the boundary between CZ and MZ in (L–M). In all panels, age of the larvae is 96 hr AEH. The nuclei are marked with DAPI (Blue). Individual dots represent biological replicates. Error bar: standard deviation (SD). Data are mean ± SD. *p<0.05, **p<0.01, and ***p<0.001.


