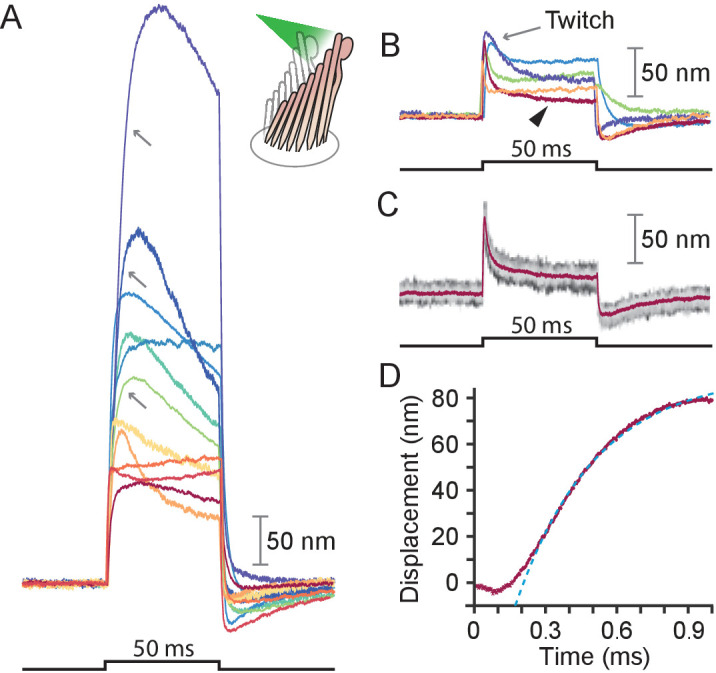
Figure 2. Responses of hair bundles from the bullfrog’s sacculus.

(A) Although all hair bundles displayed rapid movements at the onset and conclusion of photonic stimulation, some exhibited relatively slow approaches to their peaks and slow relaxations. Eleven hair bundles were stimulated in the positive direction with 561 nm light with 30 mW at the fiber’s entrance, or about 15 mW at the fiber’s output; each trace is the average of 25 responses. The schematic diagram here and in the subsequent figures shows the experimental configuration. (B) Five of the other hair bundles displayed moved rapidly at the onset of irradiation, then relaxed to plateau displacements. (C) A representative trace, marked by an arrowhead in panel B, portrays the decay of a response to a plateau level and the undershoot after stimulation characteristic of slow adaptation. The 25 individual traces that combine into the average (red) are shown in gray scale. (D) The rising phase of the same response is fitted with to an exponential with time constant 335 s (dashed blue line). The data at times below 250 μs were not included in the fit.
