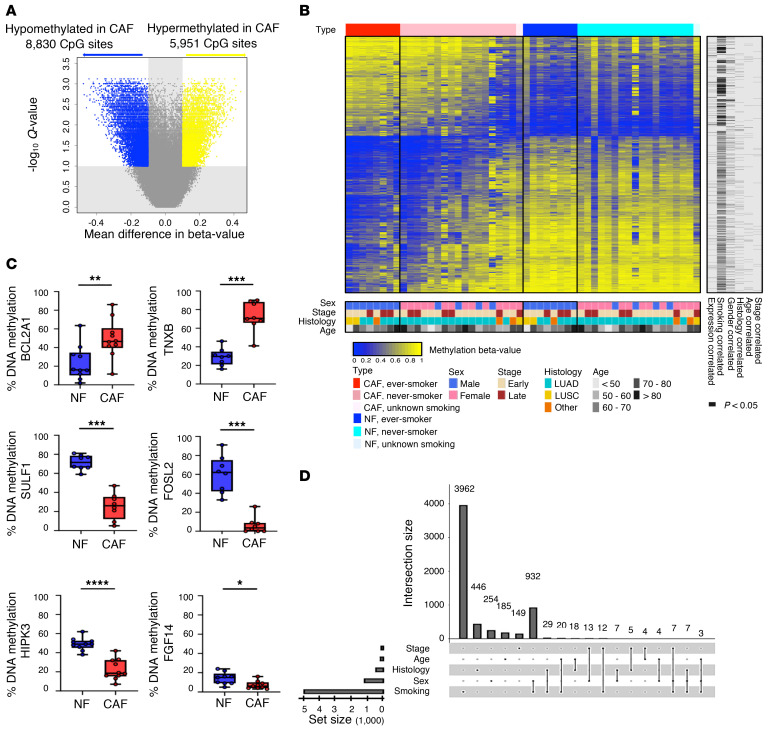
Figure 3. DNA methylation analysis of primary cultured NFs and CAFs from NSCLC patients.
(A) Volcano plot of the differentially methylated (DM) CpG sites between NFs and CAFs. A probe is significant if the difference in β value is greater than 0.1 and Q is less than 0.1. (B) Heatmap of the DM probes on 26 pairs of primary cultured NF/CAF samples from NSCLC patients. The methylation level of each CpG site is presented by a β value ranging from zero to one. Unmethylated is indicated in blue, methylated is in yellow. Rows represent probes and columns represent samples. Clinical characteristics are indicated in the bottom. Samples with the same smoking status were ordered by the aggregated methylation changes of these DM sites defined by the sum of Δβ values multiplied by the sign of the average Δβ across all samples. The same ordering was applied for the matching CAF and NF samples. The significantly (P < 0.05 by Welch’s t test; for age, Pearson’s correlation coefficient was tested using the t test) correlated expression data and clinical variables are indicated in the right columns. (C) Analysis of DM genes hyper- or hypomethylated in CAFs in NF/CAF pairs (n = 8–10 per gene) by pyrosequencing. Data presented as mean ± SD; symbols represent individual samples. *P < 0.05, **P < 0.01, ***P < 0.001, ****P < 0.0001 by Mann-Whitney U test. Box plots display the median, first and third quartiles with whiskers as maximum and minimum values. (D) UpSet plot for the intersections among the 5 sets of the DM CpG sites correlated significantly (P < 0.05 by Welch’s t test; for age, Pearson’s correlation coefficient was tested using the t test) with tumor histology, stage, age, sex, and patients’ smoking status. The set of smoking-correlated DM sites overwhelmingly outnumbered other variables.

