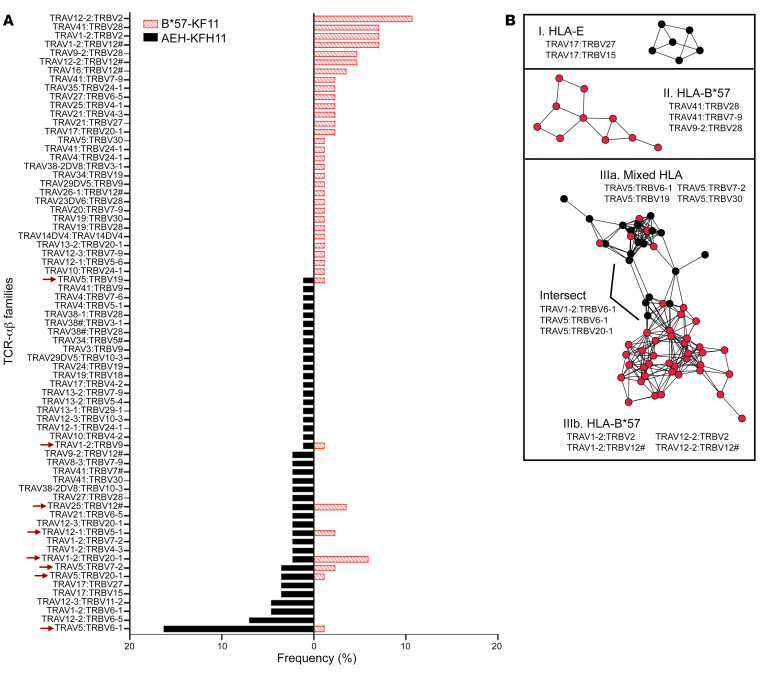
Figure 7. Ex vivo single-cell-based TCR-αβ profiles of CD8+ T cells activated by KF11-pulsed AEH or B*57 target cells.
(A) The frequencies of TCR-αβ variable gene pairs used to recognize KF11 presented by either HLA-E or B*57. Arrows indicate cases where the same variable gene pair was isolated from both HLA-E– and B*57-restricted T cells. (B) Network graphs depict clusters of similar KF11-specific TCR-αβ sequences restricted by HLA-E only (black nodes; cluster I, top), B*57 only (red nodes; cluster II, middle), or both HLAs (cluster III, bottom), identified using TCRdist with a Hamming distance threshold of 150. Cluster III included subclusters of TCRs restricted by both HLAs (Mixed, IIIa) or B*57 only (IIIb), and a small number of clones that linked these subclusters (labeled Intersect). The predominant variable gene pairs present within each cluster and subcluster are indicated.

