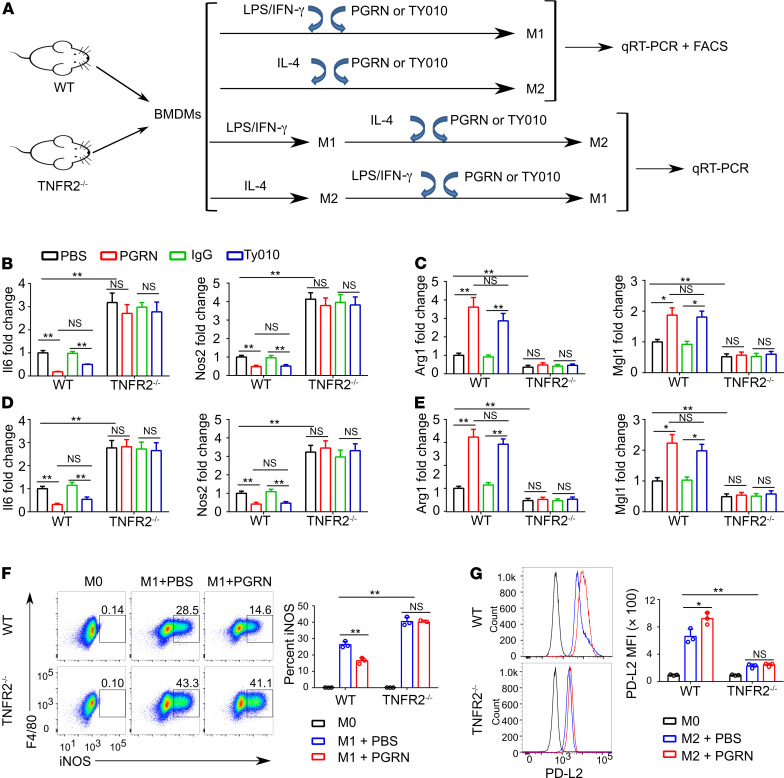
Figure 1. TNFR2 signaling controls macrophage polarization.
(A) Schematic diagram illustrating the in vitro experimental design. (B) Fold change of Il6 and Nos2 mRNA in WT and TNFR2–/– BMDMs polarized to M1 with LPS/IFN-γ in the presence or absence of 0.5 μg/mL PGRN or 2.5 μg/mL TY010 for 18 hours. (C) Fold change of Arg1 and Mgl1 mRNA in WT and TNFR2–/– BMDMs polarized to M2 with IL-4 in the presence or absence of 0.5 μg/mL PGRN or 2.5 μg/mL TY010 for 18 hours. (D and E) BMDMs from WT and TNFR2–/– were polarized to M2 (IL-4) or M1 (LPS/IFN-γ) for 18 hours. Media were removed and M2 macrophages were treated with M1 stimuli (LPS/IFN-γ) while M1 macrophages were treated with M2 stimuli (IL-4) with or without 0.5 μg/mL PGRN or 2.5 μg/mL TY010 for an additional 18 hours. Quantitative PCR (qPCR) was performed to measure the expression of Nos2 and Il6in M2 macrophages polarized to M1 (D), and the expression of Arg1 and Mgl1in M1 macrophages polarized to M2 (E). (F and G) Flow cytometry analysis of WT and TNFR2–/– BMDMs polarized to M1 (F) or M2 (G) in the absence and presence of PGRN. CD45+CD11b+ cells were gated, and iNOS+ cells or PD-L2 mean fluorescence intensity (MFI) were analyzed. Data are mean ± SD; n = 3 biological replicates; significant difference was analyzed by 1-way ANOVA with Bonferroni’s post hoc test; *P < 0.05 or **P < 0.01.

