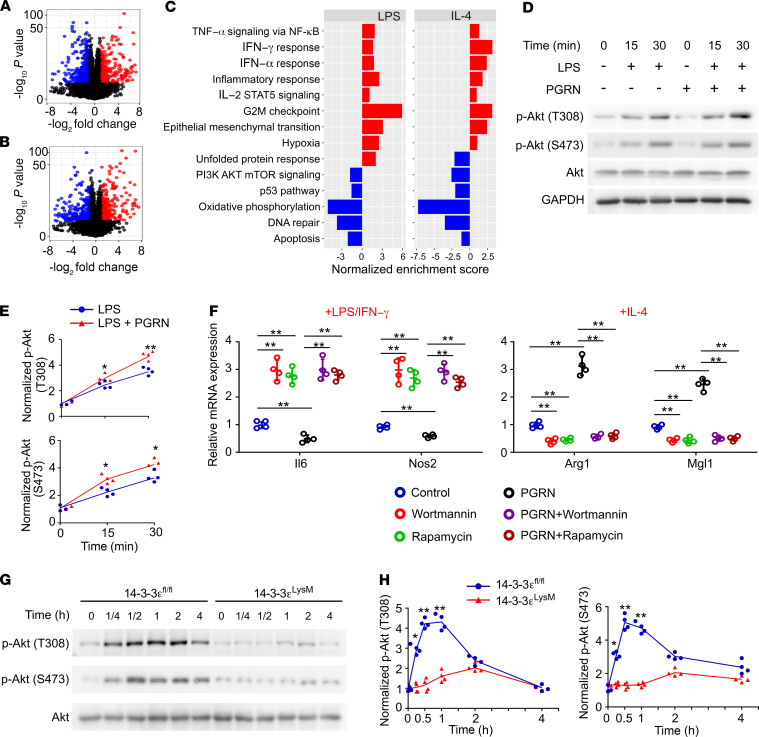
Figure 8. PI3K/Akt/mTOR pathway is involved in 14-3-3ε regulation of macrophage polarization.
(A and B) Volcano plots of differentially expressed transcripts in LPS/IFN-γ (A) or IL-4 (B) polarized 14-3-3εfl/fl and 14-3-3εLysM macrophages obtained by RNA sequencing; n = 3 biological replicates. Linear models with empirical Bayes statistic (Limma) were used for differential expression. Genes in red or blue are upregulated or downregulated, respectively, in 14-3-3εLysM as compared with 14-3-3εfl/fl macrophage with Benjamini–Hochberg adjusted P < 0.05. (C) GSEA using hallmark gene sets from the Molecular Signature Database. The statistically significant signatures were filtered by gene sets with FDR less than 0.25. Red bars represented the pathways upregulated in the 14-3-3εLysM macrophages and blue bars indicated those enriched in 14-3-3εfl/fl macrophages. (D) Immunoblotting of pAkt and Akt in LPS- and PGRN-stimulated WT BMDMs. GAPDH was used as the loading control. (E) Densitometry analysis of immunoblotting results shown in D. (F) mRNA expression in PI3K- or mTOR inhibitor–treated BMDMs polarized to M1 (LPS/IFN-γ) or M2 (IL-4) in the presence or absence of 0.5 μg/mL PGRN. (G) Immunoblotting of pAkt and Akt in 14-3-3εfl/fl 14-3-3εLysM BMDMs stimulated with LPS. GAPDH was used as the loading control. (H) Densitometry analysis of immunoblotting results shown in G. In D–H, data are mean ± SD; n = 4 biological replicates; significant difference was analyzed by 1-way ANOVA with Bonferroni’s post hoc test.

