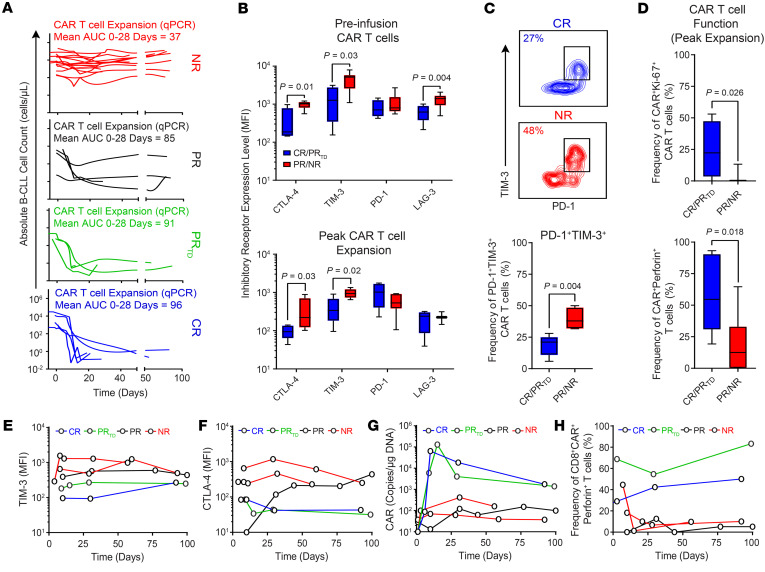
Figure 1. Exhaustion phenotypes are on-treatment biomarkers of resistance to CD19 CAR T cell therapy.
(A) Absolute numbers of B-CLL cells in the blood of patients treated with CAR T cells are shown (NR with no/poor CAR T cell expansion, n = 15; PR, n = 5; PRTD, n = 3; CR, n = 5). The expansion capacity of CAR T cells in each patient response group as determined by AUC calculations (copies per microgram genomic DNA, AUC 0–28 days) is indicated above each graph. (B) Expression levels of inhibitory receptors (CTLA-4, TIM-3, PD-1, and LAG-3) on preinfusion (top) and postinfusion (bottom) CAR T cells at the peak of in vivo expansion in the blood of the CR/PRTD versus PR/NR patients. (C) Flow cytometric plots of peripheral blood CAR T cells at the peak of in vivo expansion from representative CR and NR patients coexpressing PD-1 and TIM-3 are shown (top). Frequencies of CAR T cells coexpressing these inhibitory receptors in CR/PRTD compared with PR/NR patients are summarized as box plots (bottom). (D) Proportions of peak expansion CAR T cells expressing Ki-67 (top) and perforin (bottom) in CR/PRTD relative to PR/NR patient groups are shown. In all boxplots, boxes extend from the 25th to 75th percentiles; middle line, median; whiskers, minimum, and maximum. P values calculated using a Mann-Whitney test. (E) Longitudinal TIM-3 and (F) CTLA-4 expression on postinfusion CD8+CAR+ T cells at indicated time points. (G) CAR T cell expansion levels and (H) frequencies of perforin-expressing CD8+CAR+ T cells are shown in representative patients from the above response groups.

