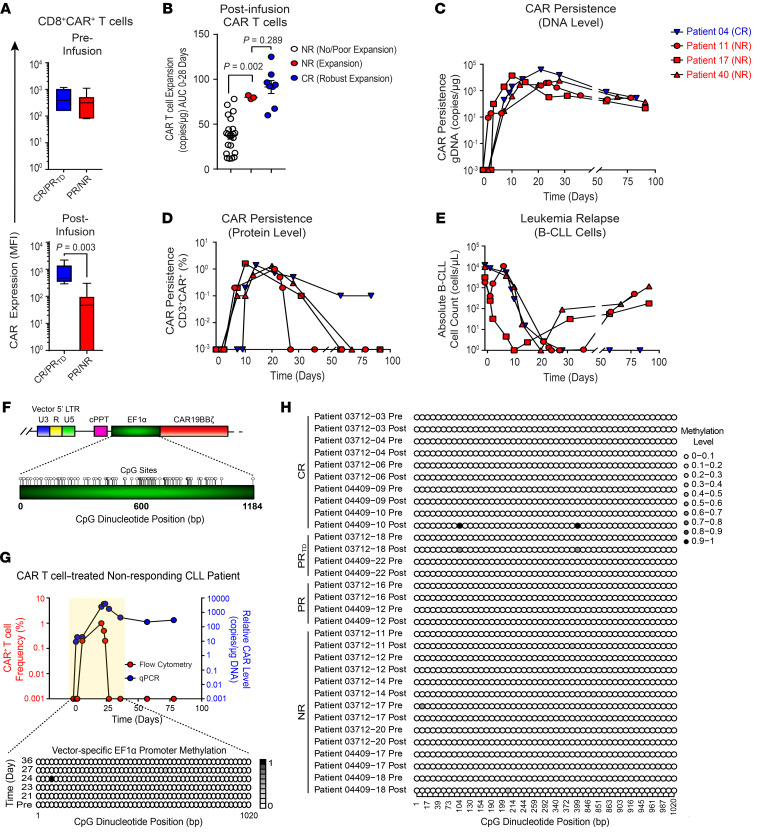
Figure 2. CAR extinction is associated with decreased expression of the transgenic protein despite persistence of the transgenic DNA and occurs independently of promoter methylation.
(A) Boxplots of CD19 CAR expression levels on preinfusion (top) and postinfusion (bottom) CD8+CAR+ T cells in CR/PRTD versus PR/NR groups. (B) CAR T cell expansion capacity as indicated by AUC 0–28-day calculations in NRs with no/poor CAR T cell expansion, NRs with CAR T cell expansion (patients 11, 17, and 40), and CR patients. Data are shown as the mean ± SEM. (C) CAR persistence at the DNA and (D) protein levels in n = 3 NR patients exhibiting CAR T cell expansion compared with a representative CR patient showing similar kinetics. (E) B-CLL burden in the peripheral blood of the same patients above. P values determined with a Mann-Whitney test. (F) CpG dinucleotide clustering within the vector-specific EF1α promoter is shown. Each circle depicts a single CpG site. LTR, long terminal repeat; cPPT, polypurine tract; EF1α, elongation factor 1 alpha promoter; U3, upstream region; U5, downstream region; R, repeat region. (G) Genomic DNA from preinfusion and postinfusion CAR T cells of a representative NR patient who exhibited CAR extinction was isolated followed by bisulfite conversion and targeted sequencing. Longitudinal EF1α promoter methylation analysis is shown, in which each row represents a specific time point, with methylated cytosine residues depicted by shaded circles and nonmethylated residues by unshaded circles. The color indicates the relative methylation level from low (white) to high (black). (H) EF1α promoter bisulfite sequencing results of preinfusion and postinfusion CAR T cells from evaluable patients with CLL with various clinical outcomes (NR, n = 7; PR, n = 2; PRTD, n = 2; CR, n = 5).

