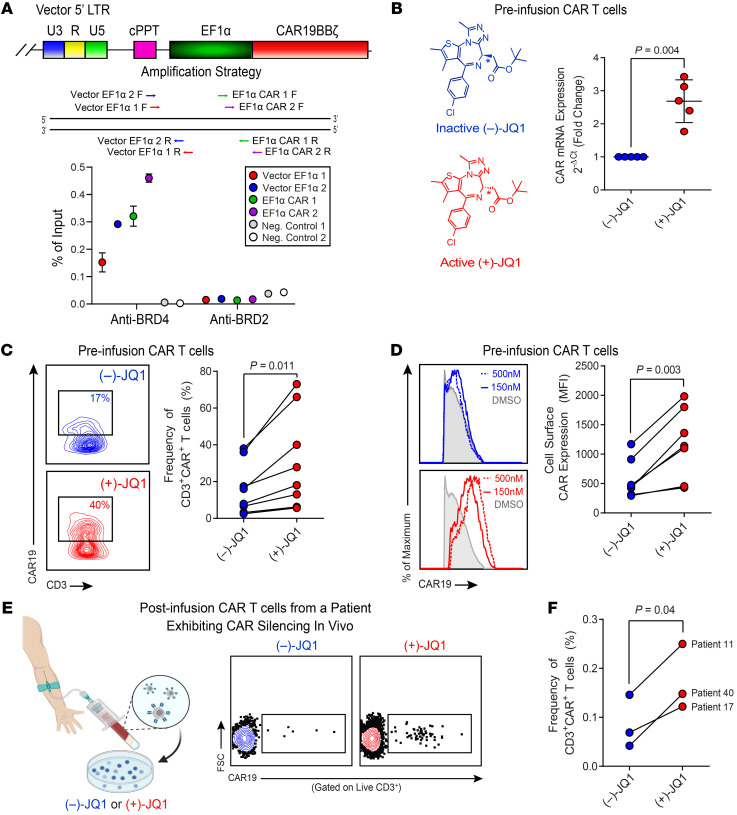
Figure 3. JQ1, a BET bromodomain inhibitor, rescues CAR expression.
(A) ChIP analysis of the CAR vector–specific EF1α promoter for BET bromodomain protein localization. A schematic of the PCR amplification for ChIP is shown (top). CAR T cells from nonresponding patients with CLL (n = 3) were subjected to ChIP with anti-BRD4 and anti-BRD2 antibodies. Enrichment of BRD4 and BRD2 at the vector-specific EF1α promoter was measured by qPCR. Data are shown as the mean ± SEM (bottom). (B) CAR T cells from nonresponders were treated with (–)-JQ1 (left panel) or (+)-JQ1 for 4 days, and real-time RT-PCR was subsequently performed to determine expression levels of the CAR transgene relative to CD3 epsilon, which served as a loading/normalization control. Fold expression levels of CAR in active JQ1-treated patient T cells compared with those in T cells treated with an inactive control are shown (n = 5, paired t test). Data are shown as the mean ± SEM. (C) Changes in the frequencies of nonresponding CLL patient CD3+CAR+ T cells (representative contour plots, left; graphical data summary, right) and (D) CAR expression levels as denoted by MFI of an antiidiotypic antibody (representative histograms, left; summarized data, right) after a 4-day incubation with 150–500 nM (–)-JQ1 or (+)-JQ1 are shown (n = 7, paired t test). (E) PBMCs were isolated from the peripheral blood of patients who exhibited CAR silencing in vivo (left). Cells were subsequently treated with (–)-JQ1 or (+)-JQ1 and analyzed for CAR expression (representative flow cytometric plots, middle). (F) Frequencies of CD3+CAR+ T cells from n = 3 patients were quantified (paired t test).

