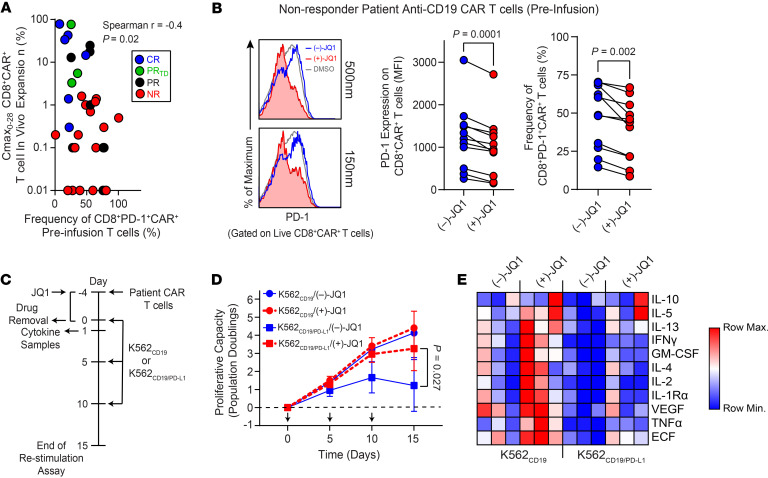
Figure 4. JQ1 reinvigorates dysfunctional CAR T cells from nonresponding patients with CLL.
(A) Spearman’s Rho correlation performed between the frequency of preinfusion CD8+PD-1+CAR+ T cells and the maximum proportion (Cmax) of in vivo expanded CD8+CAR+ T cells. Each dot represents an individual patient (n = 36) differentially colored according to therapeutic response. (B) CD8+CAR+ T cells were treated with 150–500 nM (–)-JQ1 or (+)-JQ1 for 4 days followed by evaluation of PD-1 levels. Flow cytometry histograms of PD-1 expression on CLL patient CAR+CD8+ T cells (left) are shown. PD-1 expression levels (middle) and proportions of CD8+CAR+ T cells after a 4-day incubation with 150 nM (–)-JQ1 or (+)-JQ1 are depicted (n = 11, paired t test). (C) CAR+ T cells were treated with (–)-JQ1 or (+)-JQ1 followed by stimulation with K562CD19 or K562CD19/PD-L1 cells. Functional properties of CAR T cells were then analyzed. (D) Proliferation of CAR T cells restimulated with K562 cells as indicated above (n = 3, paired t test). Arrows indicate stimulation time points. (E) Heatmap of cytokine profiles for CLL patient CAR T cells (n = 3) treated with (–)-JQ1 or (+)-JQ1 and stimulated with irradiated K562CD19 or K562CD19/PD-L1 cells is presented. Colors represent scaled cytokine data.

