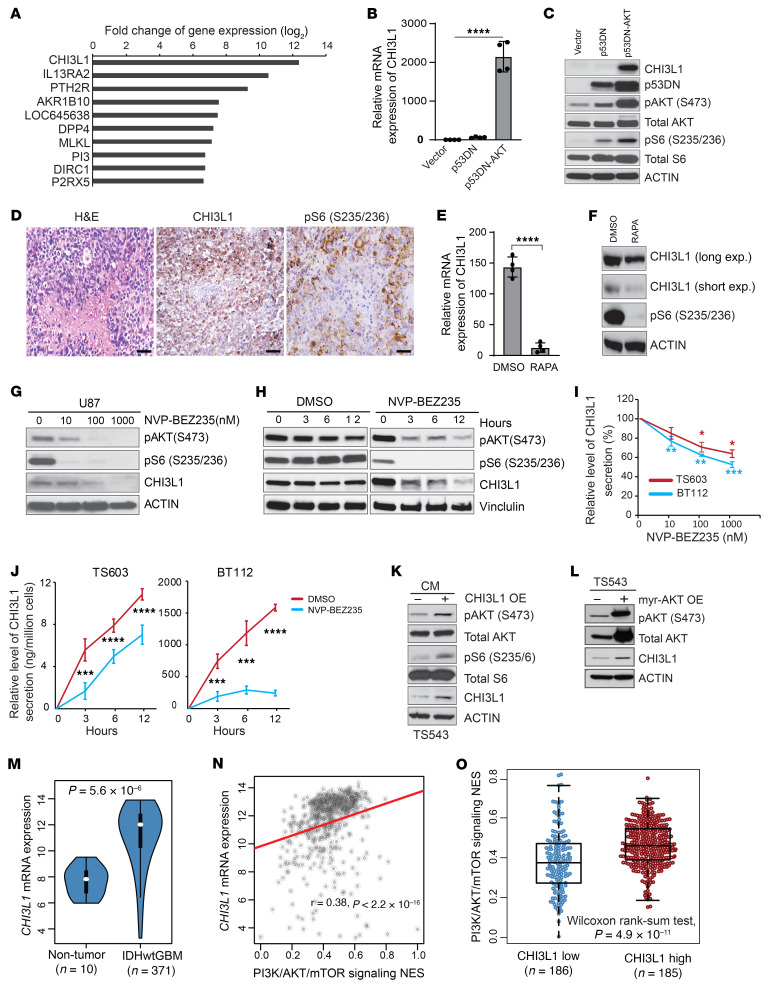
Figure 1. CHI3L1 upregulation is associated with activation of PI3K/AKT/mTOR signaling in GBM.
(A) Top 10 upregulated genes in hNSC versus hNSC-p53DN-AKT ranked by fold change of gene expression. qRT-PCR for CHI3L1 expression (B) and IB analysis of indicated proteins (C) in hNSC expressing p53DN or/and myr-AKT. (D) Representative H&E and IHC images showing indicated proteins in tumors derived from hNSCs-p53DN-AKT. Scale bars: 50 μm. qRT-PCR (E) and IB analysis (F) of indicated genes and proteins in hNSC-p53DN-AKT with rapamycin (RAPA) treatment (100 nM, 24 hours); CHI3L1 signal was shown in both long and short exposure time. IB analysis of indicated proteins in U87 treated with NVP-BEZ235 in a dose- (G) and time-dependent (H) manner. CHI3L1 secretion in the CM was assessed by ELISA from human GBM neurosphere lines treated with NVP-BEZ235 at indicated concentrations after 12 hours of treatment (I) or at a concentration of 1 μM at indicated times (J). (K) IB analysis of indicated proteins in human GBM neurosphere line TS543 treated with CM of TS543 overexpressing (OE) CHI3L1 versus control (K) or overexpressing myr-AKT versus control (L). (M) CHI3L1 mRNA expression in TCGA IDH-WT GBM tumors compared with nontumor brain tissues. Gene expression was normalized by robust multichip average (RMA), and the P values were calculated by Wilcoxon’s rank-sum test. (N) Association between CHI3L1 mRNA expression and the PI3K/AKT/mTOR signature score. Gene expression was normalized by RMA and P values were calculated by Spearman’s rank correlation. (O) Enrichment of the PI3K/AKT/mTOR signature in IDH-WT GBM with high and low levels of CHI3L1 mRNA expression. Data are presented as the mean ± SD (n ≥ 3 replicates). P values were calculated using 1-way ANOVA (B) or 1-tailed, unpaired t test (E, I, and J). *P < 0.05, **P < 0.01; ***P < 0.001; ****P < 0.0001.

