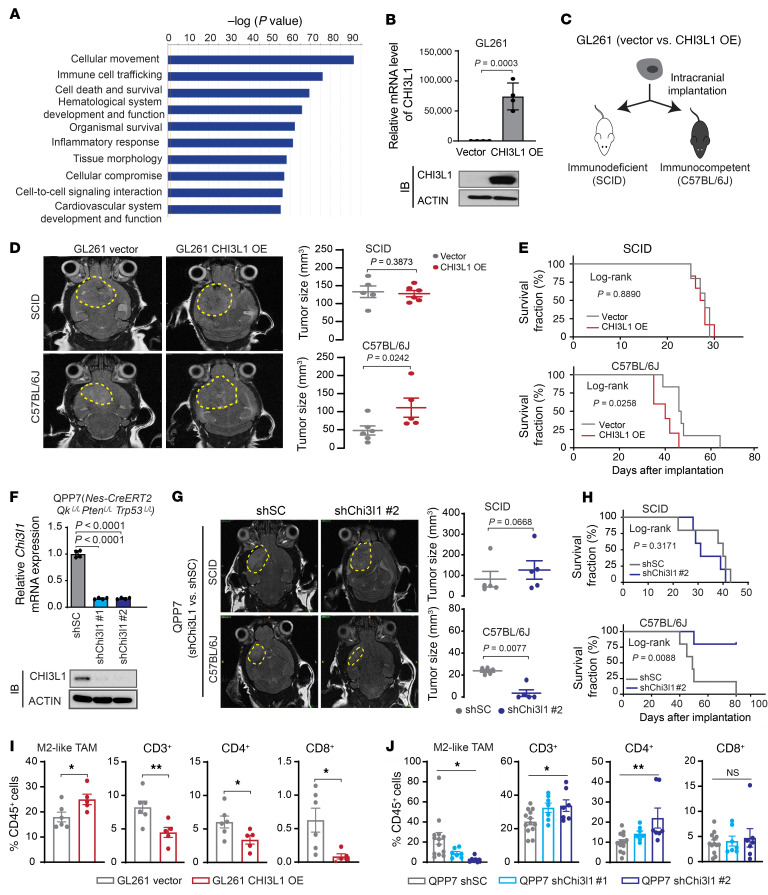
Figure 2. Tumor progression and the immune microenvironment are implicated in glioma mouse models with altering CHI3L1 expression.
(A) Top 10 biological functional pathways are enriched in CHI3L1-correlated genes in TCGA GBM data sets using IPA. (B) qRT-PCR and IB analyses of the expression levels of CHI3L1 mRNA and protein in GL261 overexpressing vector control or human CHI3L1 gene. Data are presented as mean ± SD. P values were calculated using 1-tailed, unpaired t test. (C) Illustration of 2 orthotopic xenograft models with GL261 CHI3L1 OE or vector control. (D) Representative MRI from mice after intracranial injection of GL261 with CHI3L1 OE or vector. T2 sequences demonstrate infiltrative tumors in the mouse brain (yellow line). Tumor volume was measured by the T2 MRI scan. (E) Kaplan-Meier tumor-free survival analysis of GL261 models. (F) qRT-PCR and IB analyses of the expression levels of CHI3L1 mRNA and protein in QPP7 cells infected with lentivirus carrying shRNA targeting mouse Chi3l1 gene (shChi3l1#1 and #2) versus shRNA scrambled controls (shSC). Data are presented as mean ± SD. P values were calculated by 1-way ANOVA with Dunnett’s multiple comparisons test. (G) Representative MRI from 2 orthotopic xenograft glioma mouse models bearing QPP7 with shChi3l1#2 versus shSC. Tumor volume was measured by the T2 MRI scan. (H) Kaplan-Meier tumor-free survival analysis of QPP7 models. Flow cytometry analyses of the indicated cell populations in GL261 (I) and QPP7(J) syngeneic mouse models with altering CHI3L1 expression. Dots represent mice from the group; data are presented as mean ± SEM. P values were calculated using a 1-tailed, unpaired t test (I) or 1-way ANOVA (J). *P < 0.05; **P < 0.01.

