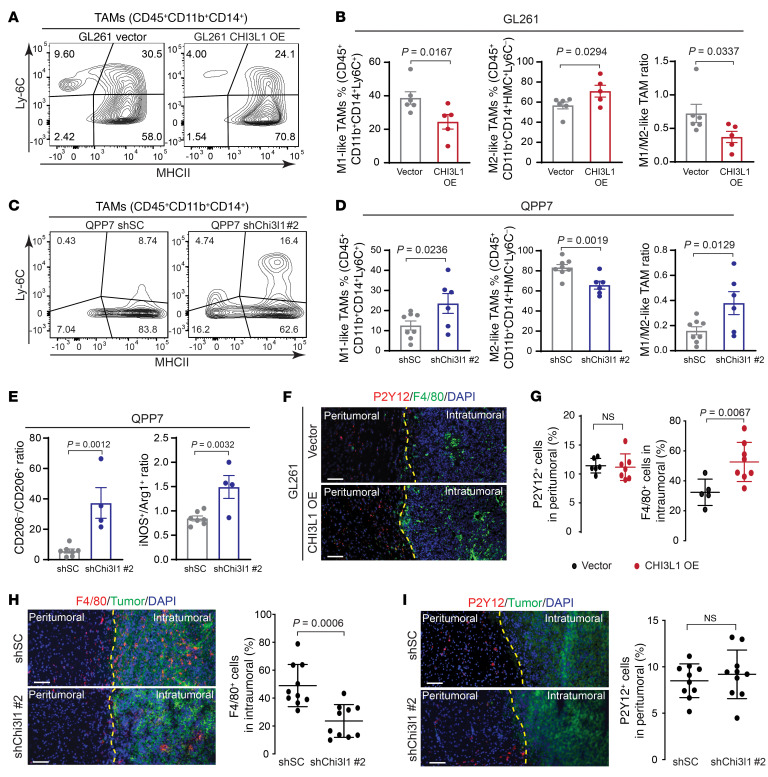
Figure 3. CHI3L1 induces M2-like MDM accumulation in vivo.
Representative flow cytometry analyses and quantitation showing the percentages of M1- and M2-like MDMs in tumors derived from GL261 (A and B) and QPP7 (C and D) glioma-bearing mice with altering CHI3L1 expression. (E) Ratio of CD206–:CD206+ cells from the CD45+CD68+CD11b+ cell population and ratio of iNOS+:Arg1+ cells from the CD45+ cell population in QPP7-derived tumors. Each dot represents 1 mouse; data are presented as mean ± SEM. P values were calculated using 1-tailed, unpaired t test. (F) Representative IF images for F4/80+ and P2Y12+ cells in tumor sections from the syngeneic mice bearing GL261-CHI3L1 versus vector control. (G) Quantitation of indicated cells in peritumoral and intratumoral regions, respectively. Representative IF images and quantitation for F4/80+ (H) and P2Y12+ (I) cells in tumor sections from QPP7 glioma-bearing mice with shChi3l1#2 versus shSC. Peritumoral and intratumoral regions are separated using yellow lines. Each dot represents 1 field of the peritumoral or intratumoral region from indicated tumors (n ≥ 3). Data are presented as mean ± SD. P values were calculated using 1-tailed, unpaired t test. Scale bars: 100 μm.

