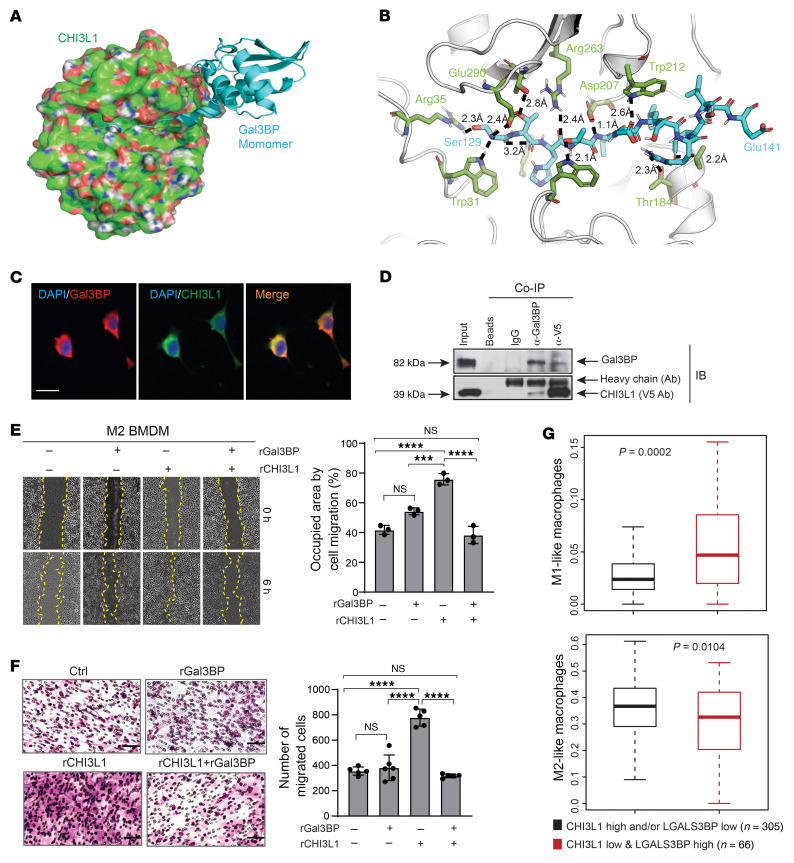
Figure 5. Gal3BP interacts with CHI3L1 for inhibition of BMDM migration in vitro.
(A) A binding model of Gal3BP monomer (cyan from PDB 6GFB) and CHI3L1 (green surface with red/blue/white shades corresponding to O/N/H atoms from PDB 1HJV_A). (B) Detailed view from A of the binding mode of Ser129-Glu141 of Gal3BP (cyan) and CHI3L1 (green). The 10 hydrogen bonds are indicated with dashed lines and distances. Several hydrophobic contacts are also shown in the protein-binding complex. (C) Representative IF images showing colocalization of proteins in TS603 cells. Scale bar: 20 μm. (D) IB analysis of protein-binding complexes after co-IP with indicated antibodies in TS603 overexpressing V5-tagged CHI3L1. (E) Representative brightfield images from the scratch-wound healing assay showing M2 BMDM cell migration at 0 and 6 hours after treatment with rCHI3L1 (2.5 μg/mL) and/or rGal3BP (5.0 μg/mL). Cell migration was assessed by quantifying occupied areas by migrated cells. (F) Representative brightfield images from the Transwell assay for M2 BMDM cell migration under treatment with rCHI3L1 (2.5 μg/mL) and/or rGal3BP (5.0 μg/mL). Migration was assessed by determining the number of migrated cells. In E and F, data are presented as mean ± SD from at least 3 independent experiments. P values were calculated using 1-way ANOVA with Tukey’s multiple comparisons test. ***P < 0.001; ****P < 0.0001. Scale bar: 50 μm. (G) Boxplots showing enrichment of M1/M2-like macrophage signature in 2 indicated groups of TCGA GBMs. P values were calculated by Wilcoxon’s rank-sum test.

