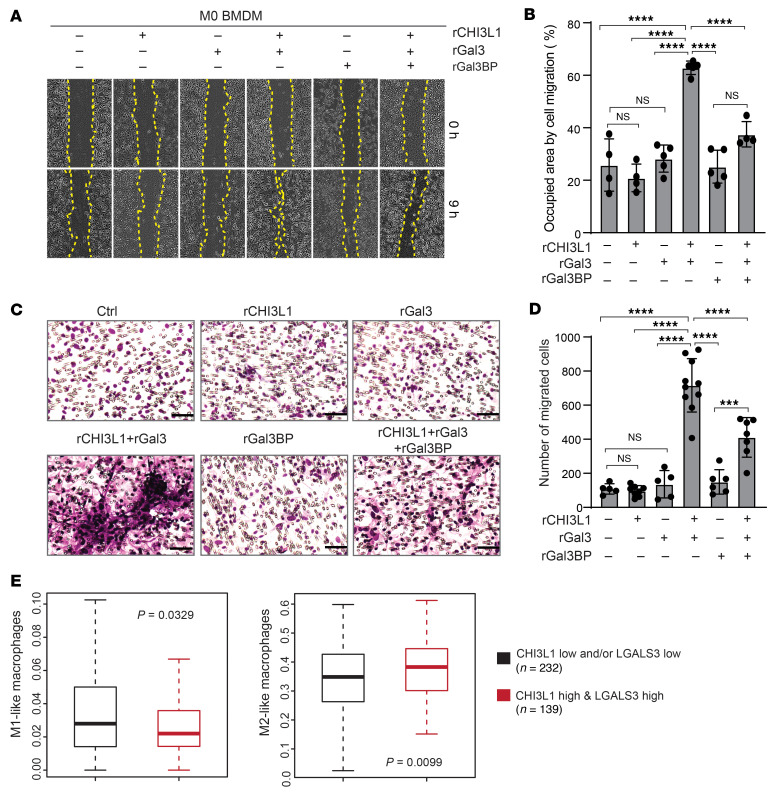
Figure 7. The CHI3L1-Gal3-Gal3BP binding complex regulates BMDM migration.
Representative brightfield images and quantitation for cell migration of M0 BMDMs treated with rCHI3L1 (2.5 μg/mL), rGal3 (2.5 μg/mL), rGal3BP (5.0 μg/mL), and combinations in the scratch-wound healing assay (A and B) and the Transwell assay (C and D). Cell migration was assessed by quantifying the occupied area or by counting the number of migrating cells, respectively. Data are presented as the mean ± SD from at least 3 independent experiments. P values were calculated using 1-way ANOVA with Tukey’s multiple comparisons test. ***P < 0.001; ****P < 0.0001. Scale bars: 50 μm. (E) Boxplots showing enrichment of M1/M2-like macrophage signature in 2 indicated groups of TCGA GBMs. P value was calculated by Wilcoxon’s rank-sum test.

