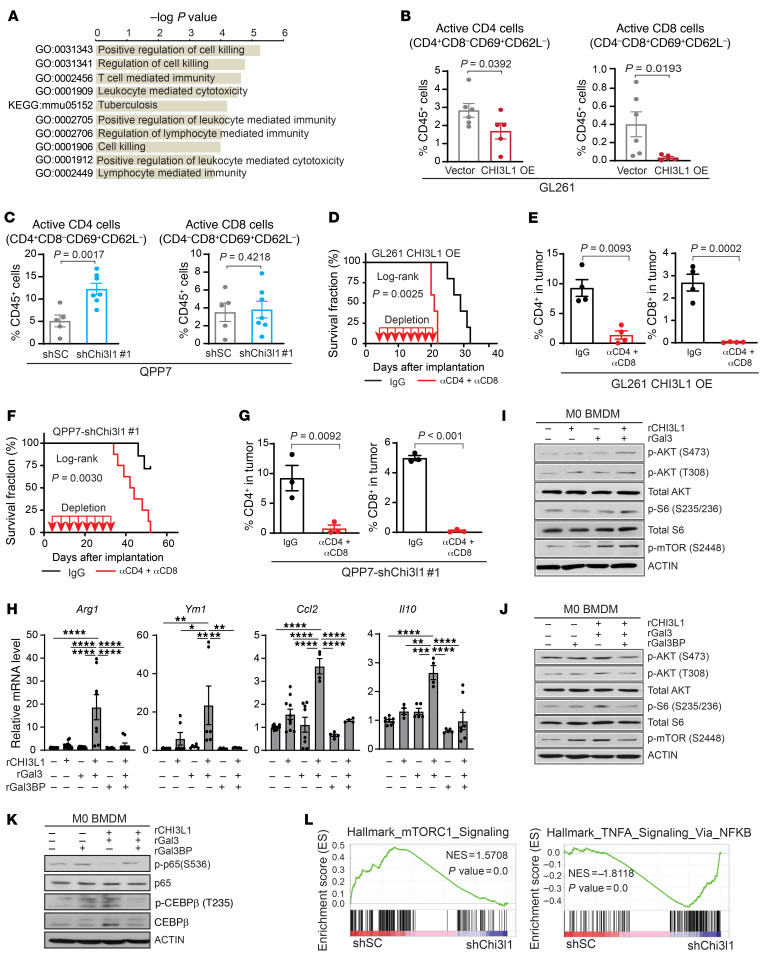
Figure 8. CHI3L1 protein complexes regulate MDM reprogramming in immune suppression and stimulation.
(A) Enrichment of top 10 GO biological pathways in TAMs derived from C57BL/6 mice bearing QPP7 with shChi3l1 compared with shSC. (B) Flow cytometry analysis showing active CD4+ and CD8+ cells in GL261 tumors with CHI3L1 OE compared with vector controls. (C) Flow cytometry analysis showing active CD4+ and CD8+ cells in QPP7 tumors with Chi3l1 KD compared with shSC. Depletion antibodies against CD4 and CD8 (10 mg/kg) were injected intraperitoneally every 3 days for a total of 8 times after tumor implantation. Kaplan-Meier tumor-free survival analysis of mice bearing GL261 overexpressing CHI3L1 (D) and mice bearing QPP7 with Chi3l1 KD (F). Flow cytometry analysis showing CD4+ and CD8+ cell populations within the tumors from GL261 models (E) and QPP7 models (G) with antibody depletion. Each dot represents 1 mouse; data are presented as mean ± SEM. P values were calculated using a 1-tailed, unpaired t test. (H) qRT-PCR for indicated gene expression in M0 BMDMs treated with rCHI3L1 (2.5 μg/mL), rGal3 (2.5 μg/mL), rGal3BP (5.0 μg/mL), and combinations for 24 hours. Data are presented as mean ± SEM from at least 2 independent experiments. P values were calculated using 1-way ANOVA with Tukey’s multiple comparisons test. *P < 0.05; **P < 0.01; ***P < 0.001; ****P < 0.0001. (I–K) IB analysis of indicated protein levels in M0 BMDMs treated with rCHI3L1 (2.5 μg/mL), rGal3 (2.5 μg/mL), rGal3BP (5.0 μg/mL), and combinations for 30 minutes or 4 hours (p-p65 and p65). (L) GSEA plots depicting mTOR1 and TNFA/NFKB signaling pathways in TAMs derived from C57BL/6 mice bearing QPP7 with shChi3l1 compared with shSC. NES, normalized enrichment score.

