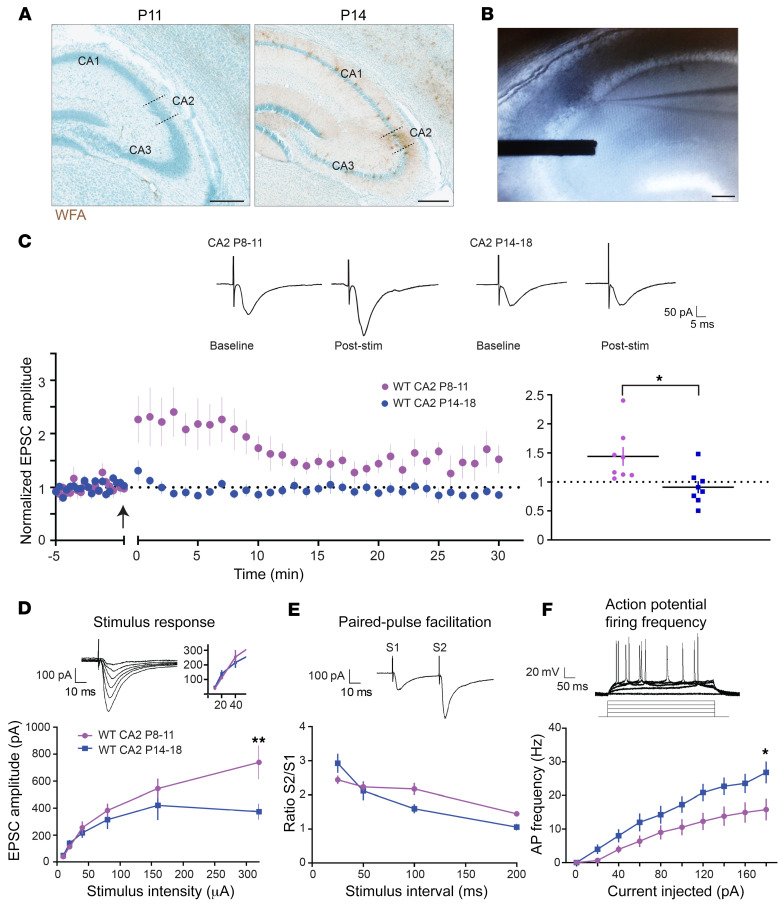
Figure 2. Potentiation in CA2 can be induced before PNN maturation.
(A) Staining for PNNs as defined by WFA is morphologically mature in CA2 at P14 (right) but not at P11 (left). Scale bars: 250 μm. (B) Representative image of a 300-μm-thick hippocampal slice showing the placement of a recording electrode in CA2 and a stimulating electrode in CA3 stratum radiatum. Scale bar: 100 μm. (C) In slices from WT mice, excitatory postsynaptic current (EPSC) amplitudes recorded in CA2 neurons increased in response to an LTP pairing protocol (270 pulses at 3 Hz paired with postsynaptic depolarization at time 0) at P8–11, but not in slices harvested at P14–18 (n = 8 for P14–18, in blue; n = 9 for P8–11, in purple). Top: Representative traces of EPSCs from CA2 neurons before and 25 minutes after the pairing protocol. Arrow indicates time of the pairing. Indicated are means ± SEM, normalized to baseline. Right: Normalized mean response amplitudes averaged over 25–30 minutes of recovery after pairing; *P = 0.0104, 2-tailed unpaired t test. (D) EPSC amplitudes in response to indicated stimulation intensities were larger at P11 compared with P14; **P = 0.0026 at 320 pA, 2-way ANOVA, Bonferroni’s post hoc test (n = 9 and 8, P8–11 and P14–18, respectively). Top: Representative traces from a CA2 neuron at P10 in response to increasing stimulation intensities. Inset displays responses at lower stimulation intensities, the range at which LTP experiments were performed. (E) Paired-pulse ratio was unchanged between P8–11 and P14–18 at CA2 synapses; P > 0.05. Top: Representative trace from WT CA2 P11 neuron in response to a 50-millisecond stimulus interval (S1, peak of first stimulus response; S2, peak of second stimulus response). (F) Action potential firing frequency of P14–18 CA2 neurons was greater compared with that at P8–11 at 180 pA of injected current; *P = 0.0185, 2-way ANOVA, Bonferroni’s post hoc test (n = 13 and 20, P8–11 and P14–18, respectively). Top: Representative traces of action potentials recorded in response to current injections from 0 to 180 pA in WT P11.

