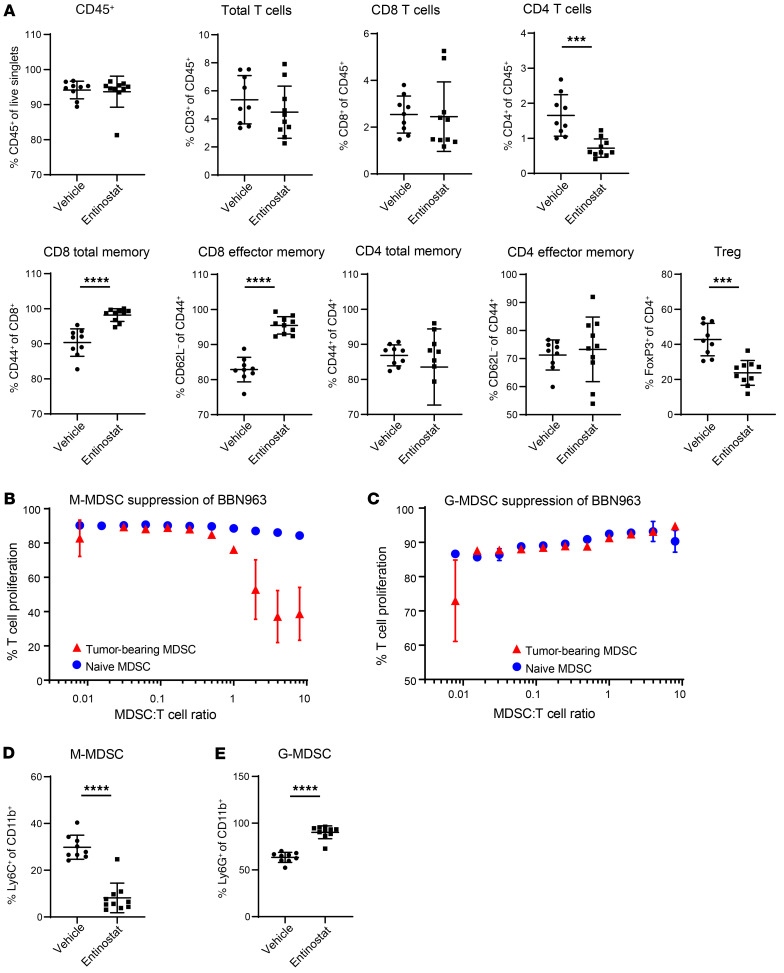
Figure 3. Entinostat increases antigen-experienced T cell responses and decreases immune-suppressive populations.
(A) Percentages of different representative immune cells in vehicle-treated (n = 9) and entinostat-treated (n = 10) tumors using flow cytometry. (B) T cell proliferation when cultured with increasing numbers of M-MDSCs per T cell. (C) T cell proliferation when cultured with increasing numbers of G-MDSCs per T cell. (D) Proportion of lineage-negative CD11b+ cells that are Ly6G– and Ly6C+ (M-MDSC) in vehicle-treated (n = 9) and entinostat-treated (n = 10) tumors. (E) Proportion of lineage-negative CD11b+ cells that are Ly6G+ (G-MDSC) in vehicle-treated (n = 9) and entinostat-treated (n = 10) tumors. Significance was calculated using Mann-Whitney U test. Data are represented as mean ± SD. **P < 0.001; ****P < 0.0001.

