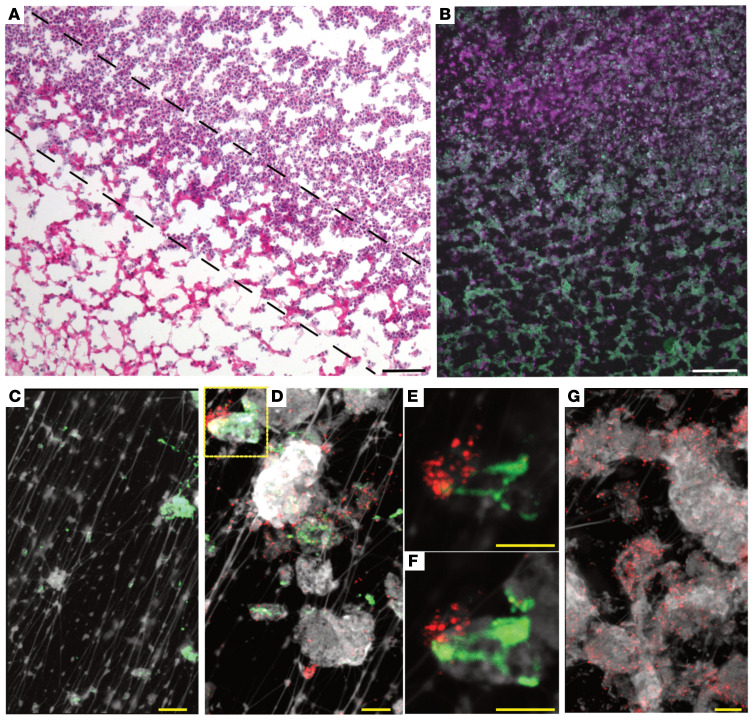
Figure 1. Composite of images that depict the zone between the biofilm and the abundance of PMNs elicited to the site of infection.
(A) Low-magnification light micrograph of an H&E-stained frozen section of a 17-day biofilm produced by nontypeable Haemophilus influenzae (NTHI) in the middle ear of the chinchilla during experimental otitis media. Area of dense PMN infiltration primarily located in top right-hand corner region, whereas NTHI-induced biofilm occupies the lower left-hand region of image. Zone where these 2 regions meet is demarked by dashed lines. Scale bar: 100 μm. (B) Image of a serial section of the in situ biofilm shown in A, where the PMN-rich area intersects with the NTHI biofilm, immunolabeled with antibodies directed against elastase to demark the PMNs (shown in violet) and antibodies directed against NTHI outer membrane proteins to demark the NTHI-induced biofilm (shown in green) as well as the area of intersection where both fluorochromes are visible as admixed. Scale bar: 100 μm. High-magnification immunolabeled confocal image of an 11-day-old NTHI biofilm recovered from the chinchilla middle ear: (C) NTHI biofilm nearly exclusively labeled with antibodies to the DNABII protein HU (green) where HU labeling is detected on strands of bacterial eDNA (white); (D) area where NTHI-induced biofilm intersects with PMN-rich region where anti-DNABII (HU) labeling is evident (green) as well as labeling with anti-HMGB1 (red); (E and F) are consecutive 1 μm Z-plane images of the inset designated in D, which demonstrate that there is no physical overlap of DNABII and HMGB1 labeling. (G) PMN-rich area wherein the labeling is exclusively by anti-HMGB1. Scale bars in C–G: 5 μm.

