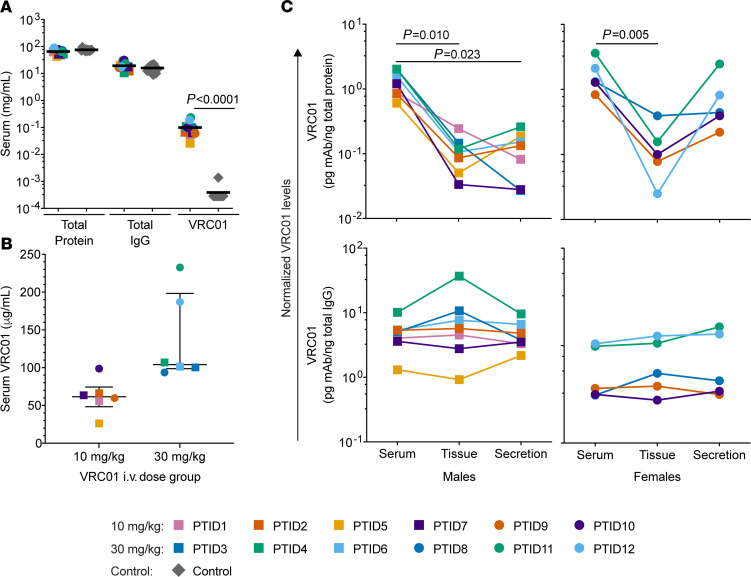
Figure 2. Detection of i.v.-infused VRC01 in systemic and mucosal compartments of male and female participants.
(A) Comparison of total protein, IgG, and VRC01 levels in serum from VRC01-infused male (squares, n = 7) and female (circles, n = 5) participants and control participants (n = 11). (B) Absolute serum VRC01 levels in men and women infused with 10 mg/kg (yellow, orange, and purple) or 30 mg/kg VRC01 (green and blue) (n = 12). (C) Normalized VRC01 levels in sera, secretions, and mucosal tissue homogenates from male (left) and female (right) VRC01-infused participants (n = 12). Levels were normalized to total protein (top) and total IgG (bottom). Friedman’s tests were first used to compare normalized levels within paired sera, secretions, and tissues, and then statistical significance was assessed between 2 specific compartments using Dunn’s tests. Correlation was determined by Spearman’s rank coefficients.

