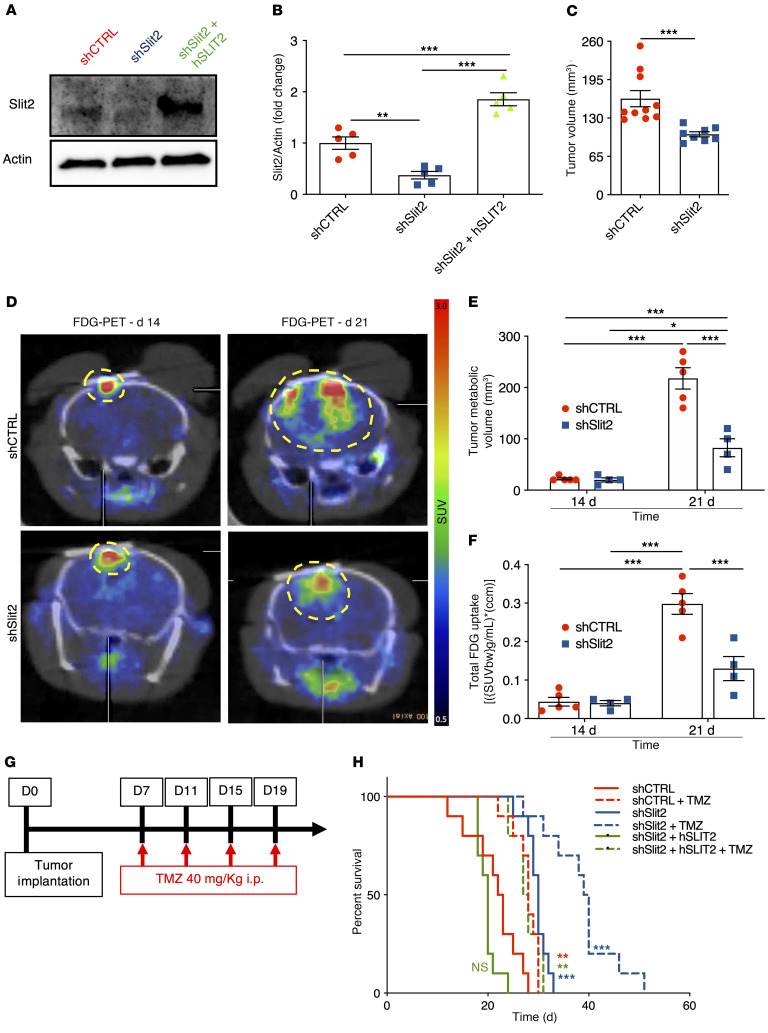
Figure 2. Slit2 promotes glioblastoma growth and resistance to TMZ.
(A and B) Western blot analysis (A) and quantification (B) of Slit2 expression in shCTRL, shSlit2, and shSlit2 + hSLIT2 CT-2A cells (n = 5, 1-way ANOVA). (C) Tumor volume quantification at 21 days (n = 10 for shCTRL and n = 8 for shSlit2, Student’s t test). (D) FDG-PET imaging over CT-2A shCTRL and shSlit2 glioma growth (n = 5 shCTRL and n = 4 shSlit2). (E and F) Quantification of tumor metabolic volume (E) and total tumor glucose uptake (F) from D (n = 5 for shCTRL and n = 4 for shSlit2, 1-way ANOVA). (G) Survival trial design: 8-week-old mice were engrafted with CT-2A shCTRL, shSlit2, or shSlit2 + hSLIT2 spheroids and randomly assigned to vehicle or TMZ treatment (40 mg/kg on days 7, 11, 15, and 19 after tumor implantation). (H) Survival curves of the mice in G (n = 10 mice per group, OS 22.5 days for shCTRL, 28 days for shCTRL + TMZ, 30 days for shSlit2, 39.5 days for shSlit2 + TMZ, 20 days for shSlit2 + hSLIT2, and 27 days for shSlit2 + hSLIT2 + TMZ; multiple comparisons log-rank test). Data are mean ± SEM. *P < 0.05, **P < 0.01, ***P < 0.001.

