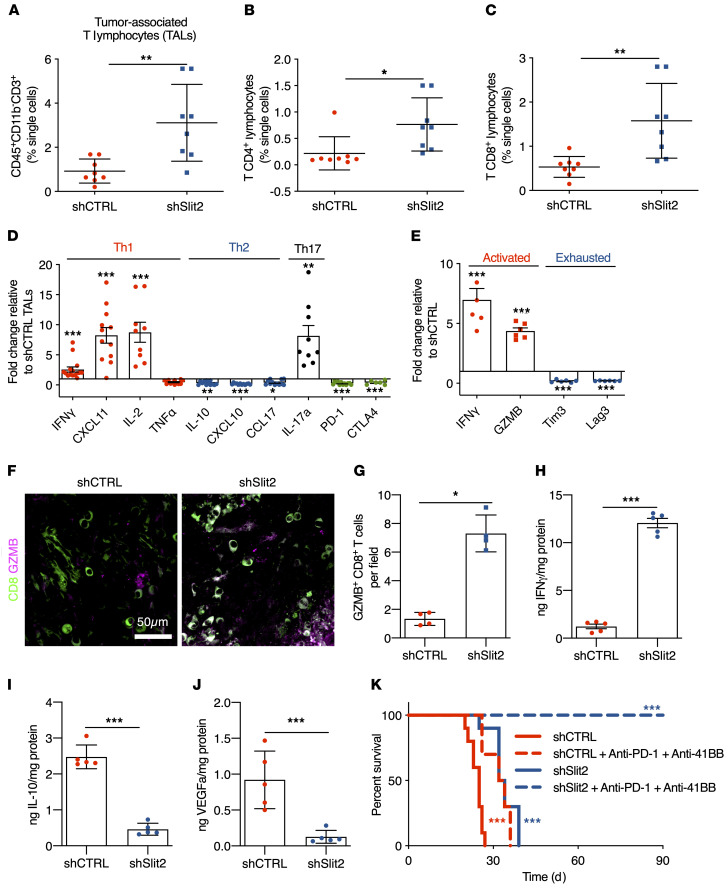
Figure 5. Slit2 inhibits T lymphocyte responses in the glioma microenvironment.
(A–C) T lymphocyte FACS analysis of day 21 CT-2A shCTRL and shSlit2 tumors for total CD3+ TALs (A), CD4+ TALs (B), and CD8+ TALs (C) (n = 8 tumors/group; Student’s t test). (D) qPCR analyses from FACS-sorted CD4+ T lymphocytes (n = 10 tumors/group, Mann-Whitney U test). (E) qPCR analyses from FACS-sorted CD8+ T lymphocytes (n = 6 tumors/group, Mann-Whitney U test). (F) Representative images of CD8 and GZMB staining on sections of day 21 CT-2A shCTRL and shSlit2 tumors. (G) Quantification of F (n = 4 mice per group, 5 fields per tumor, Mann-Whitney U test). (H–J) ELISA from protein samples extracted from FACS-sorted CD8+ TALs from shCTRL and shSlit2 tumors to quantify IFN-γ (H), IL-10 (I), and VEGFa (J) (n = 5 tumors/group, Mann-Whitney U test). (K) Eight-week-old mice were engrafted with CT-2A shCTRL or shSlit2 and randomly assigned to vehicle or anti–PD-1 + anti–4-1BB treatment (0.2 mg each on days 7, 9, 11, and 13 after tumor implantation) (n = 10/11 mice per group, OS 25 days for shCTRL, 33 days for shCTRL + anti–PD-1 + anti–4-1BB, 33 days for shSlit2, and undetermined for shSlit2 + anti–PD-1 + anti–4-1BB; multiple comparisons log-rank test). Data are mean ± SEM. *P < 0.05, **P < 0.01, ***P < 0.001.

