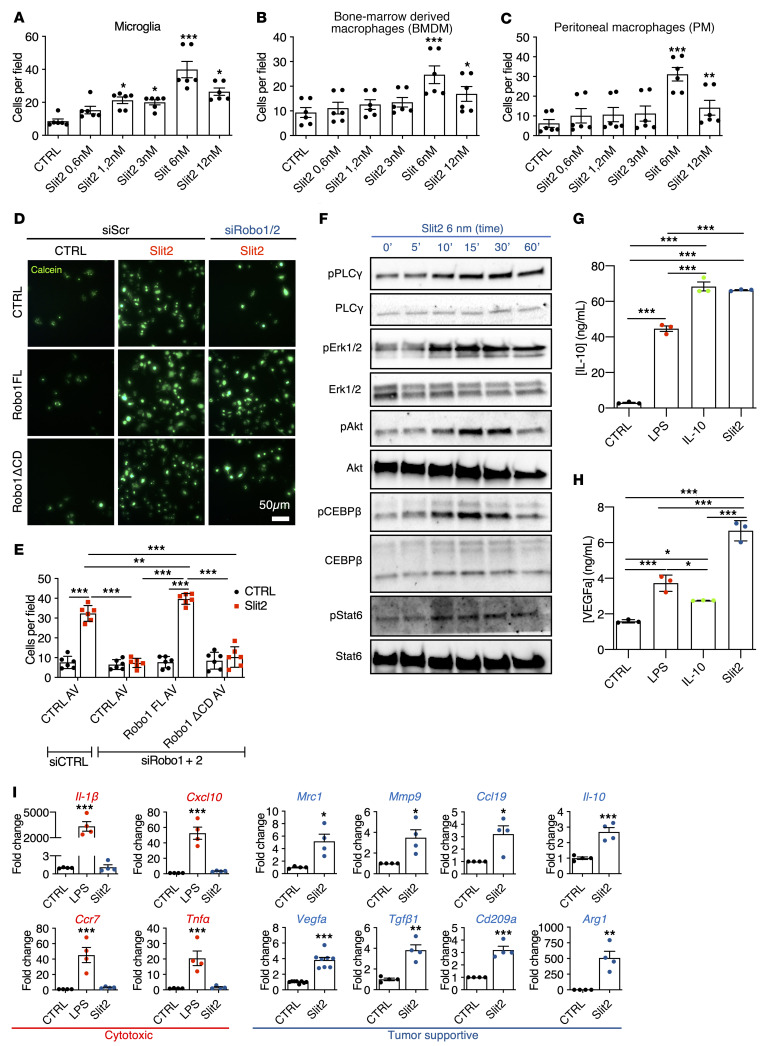
Figure 6. Slit2 drives microglia and macrophage migration and tumor supportive polarization.
(A–C) Transwell assay of microglial cells (A), BMDMs (B), and PMs (C) in response to Slit2 or carrier (CTRL) in the bottom chamber (n = 4, 1-way ANOVA). (D and E) Transwell assay of RAW macrophages treated or not with Robo1/2 siRNA and infected with adenovirus encoding CTRL (GFP construct), Robo1FL, or Robo1ΔCD constructs and stained with calcein. (E) Quantification of D (n = 3, 2-way ANOVA). (F) Western blot analysis of Slit2 downstream signaling in cultured BMDMs (n = 6). (G and H) ELISA from conditioned medium from LPS-, Il-10–, or Slit2-treated BMDMs to quantify IL-10 (G) and VEGFa (H) (n = 3 independent cultures, Mann-Whitney U test). (I) qPCR analysis of BMDM cultures following Slit2 or LPS treatment (n = 4, 1-way ANOVA or Mann-Whitney U test). Data are mean ± SEM. *P < 0.05, **P < 0.01, ***P < 0.001.

