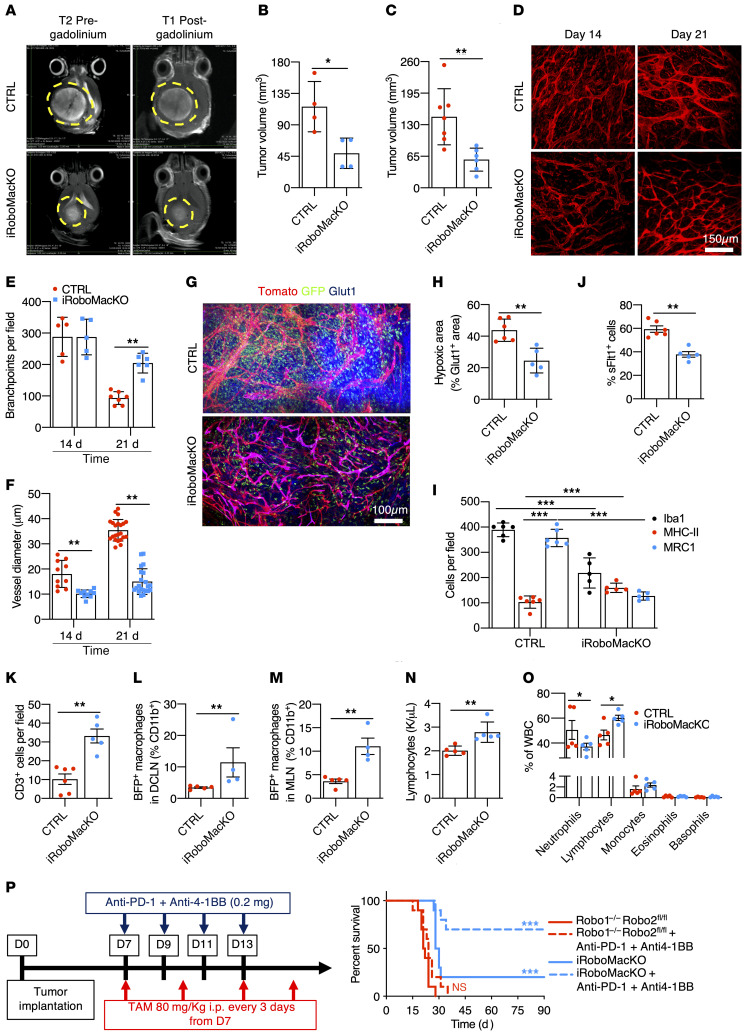
Figure 8. Macrophage-specific Robo1/2 knockout normalizes the TME.
(A) MRI images of CTRL and iRoboMacKO mice 21 days after tumor implantation. (B and C) Quantification of day 21 tumor size on MRI images (B, n = 4 tumors per group, Mann-Whitney U test) and serial vibratome sections (C, n = 7 CTRL and 6 iRoboMacKO tumors, Mann-Whitney U test). (D–F) In vivo 2-photon images of tumor-bearing mice (D) and quantification of vessel diameter (E) and branchpoints (F) (n = 6 mice per group, 1-way ANOVA). (G and H) Glut1 (blue) immunohistochemistry on day 21 tumor-bearing mice (G), and quantification of tumor hypoxic areas (H) (n = 6 CTRL and 5 iRoboMacKO tumors, Mann-Whitney U test). (I–K) Quantification of F4/80, MHC-II, and MRC1+ cells (I), sFLT1+ GFP+ cells (J), and total TALs (CD3+) (K) (n = 6 CTRL and 5 iRoboMacKO tumors, 2-way ANOVA or Mann-Whitney U test). (L and M) FACS analysis of deep cervical DCLNs and MLNs from day 21 tumor-bearing mice (n = 5 CTRL and 4 iRoboMacKO mice; Mann-Whitney U test). (N and O) Lymphocyte counts (N) and differential WBC counts (O) from peripheral blood of day 21 tumor-bearing mice (n = 5 mice/group; Mann-Whitney U test). (P) Eight-week-old mice engrafted with CT-2A BFP and treated with 80 mg/kg tamoxifen i.p. every 3 days starting 7 days after tumor implantation were randomly assigned to vehicle or anti–PD-1 + anti–4-1BB treatment (0.2 mg/dose on days 7, 9, 11, and 13 after tumor implantation) (n = 10/11 mice per group, OS 21.5 days for Robo1–/–Robo2fl/fl, 24 days for Robo1–/–Robo2fl/fl + anti–PD-1 + anti–4-1BB, 29 days for iRoboMacKO, and undetermined for iRoboMacKO + anti–PD-1 + anti–4-1BB; multiple comparisons log-rank test). Data are mean ± SEM. *P < 0.05, **P < 0.01, ***P < 0.001.

