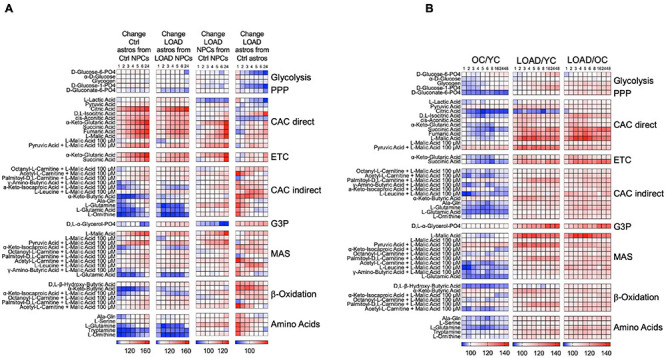
FIGURE 6.

Processing of bioenergetic substrates in iPSC-derived NPCs and astrocytes, and fibroblasts. (A,B) Data from Biolog MitoPlate S-1 assays on LOAD (n = 9) and Control (n = 9) NPCs and astrocytes (A), and YC (n = 7, average age 30.1 ± 8.6), OC (n = 7, average age 68.4 ± 10.8), and LOAD (n = 9, average age 70.9 ± 7.4) fibroblasts (B). Processing of 31 substrates were kinetically measured at 1, 2, 3, 4, 5, 6, 8, 16, 24, and 48 h, and data plotted as heat maps showing percent changes in astrocytes from NPCs reflecting changes in cell development, LOAD from Control cells reflecting disease-associated alterations, and OC from YC reflecting age. The data are from duplicate experiments and clustered according to bioenergetic functions as explained in the text.
