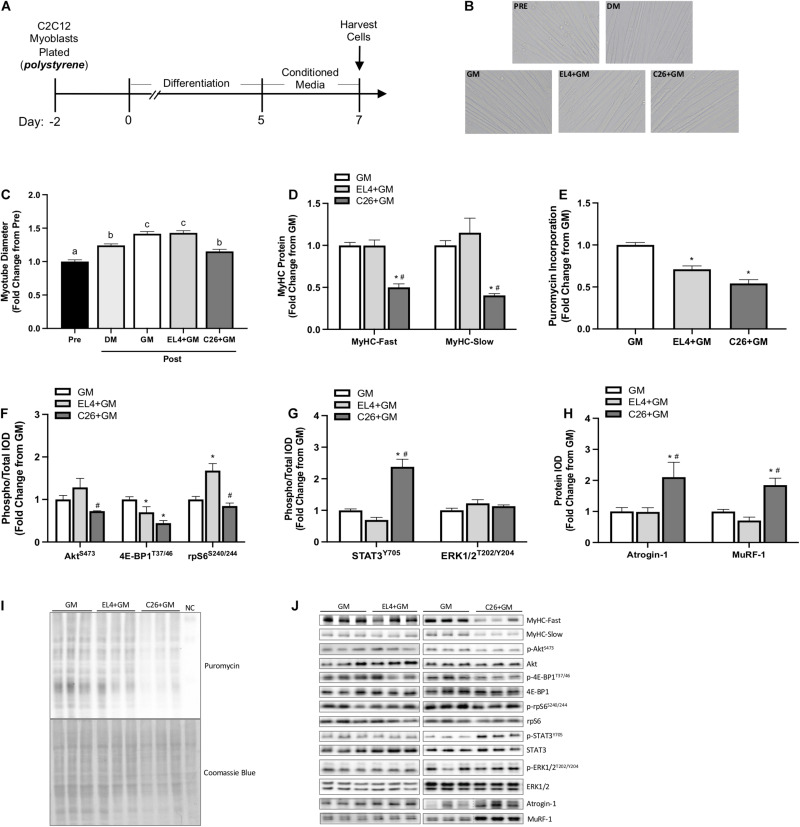
FIGURE 1.
Effects of tumor cell conditioned media on C2C12 myotube size and protein turnover signaling on type I collagen-coated polystyrene plates. (A) Experiment overview: C2C12 myoblasts are plated on type I collagen-coated rigid polystyrene plates in growth media (GM); after 48 h at ∼85% confluence, differentiation media (DM) is added, which corresponds to day 0 of differentiation. At 5 days post-differentiation, myotubes are imaged (Pre) and then 50% tumor cell conditioned media (CM) is diluted with serum-free DMEM and added to wells for 48 h. Conditioned media is collected from cachectic colon-26 (C26 + GM), non-cachectic EL4 lymphoma (EL4 + GM), or growth media with no cells, which is used as a media control (GM). Myotubes maintained in DM for 48 h are used as a control for myotube growth. Cells are harvested at day 7 post-differentiation for protein. (B) Representative × 20 brightfield myotube images. (C) Myotube diameter Pre (day 5; n = 216 myotubes) and Post (day 7; n = 162–216 myotubes/group) 48 h DM, GM, or CM incubation. (D) Myosin heavy chain (MyHC)-Fast (type II fibers) and MyHC-Slow (type I fibers) protein expression measured by Western blotting. (E) Quantified protein synthesis rate measured by Western blotting against puromycin (n = 6–12/group). Western blotting analyses of panel (F) ratio of phosphorylated (p-) to total protein expression of AktS473 (n = 6/group), 4E-BP1T37/46 (n = 6/group), and rpS6S240/244 (n = 6/group). (G) Ratio of phosphorylated (p-) to total protein expression of STAT3Y705 (n = 6–12/group) and ERK1/2T202/204 (n = 6/group) and (H) Atrogin-1/MAFbx and MuRF-1 (n = 6/group). (I) Representative Western blotting image displaying puromycin incorporation and corresponding Coomassie blue stain; NC is the negative control protein sample from C2C12 myotubes without puromycin treatment. (J) Representative Western blotting images, separate panels are from separate blots each ran with GM control, and dashed lines represent different areas of the same gel. Data are presented as means ± SEM as a fold change from GM. One-way ANOVA was performed to determine differences. Lowercase letters (a, b, and c) denote significant difference between groups; *significant from GM control; #significant from EL4 + GM. Statistical significance set at p ≤ 0.05.

