
Figure 2.
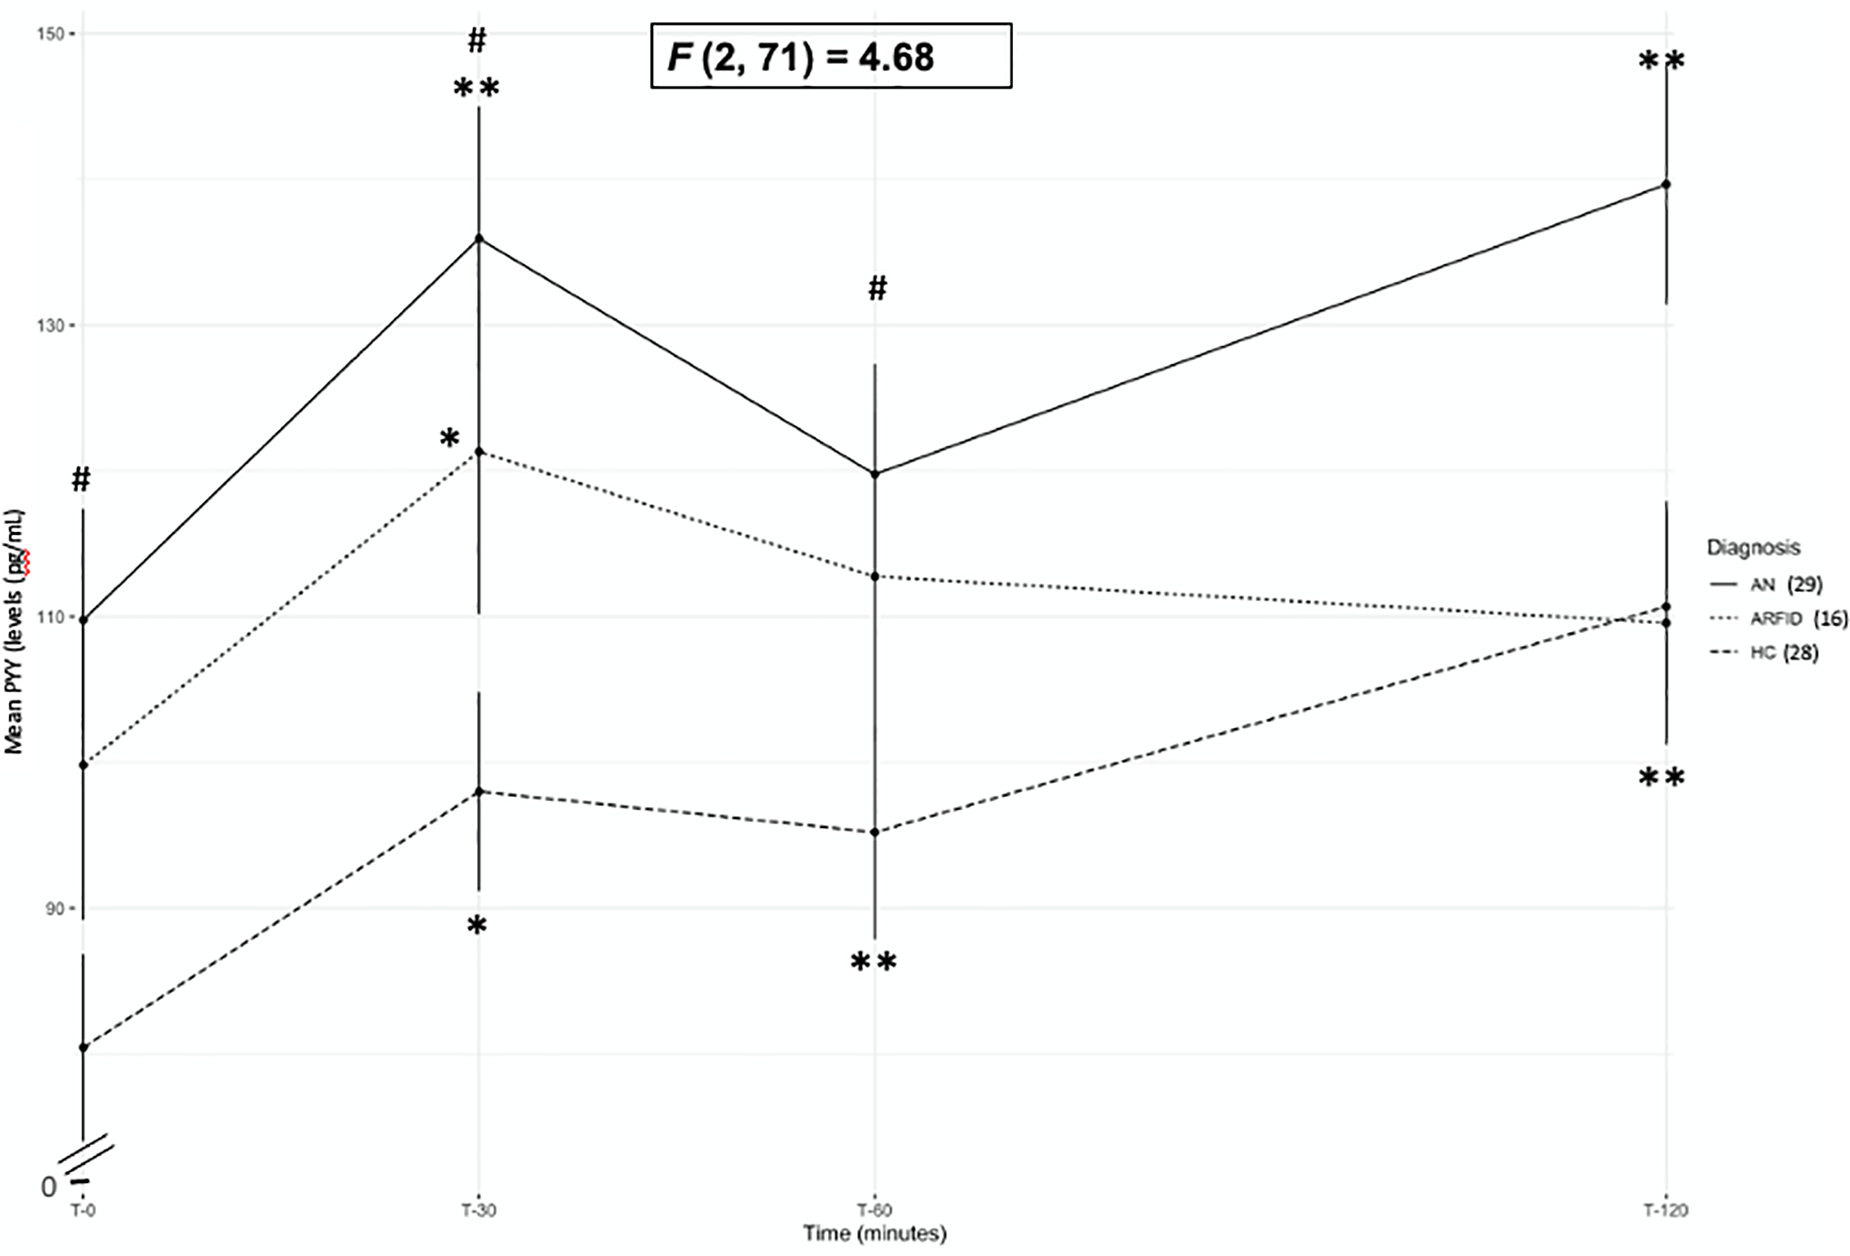
Mean PYY levels at T0, T30, T60, and T120 timepoints for anorexia nervosa/atypical anorexia-restricting (AN), avoidant/restrictive food intake disorder (ARFID) and healthy controls (HC)
Note. #=p<.05 comparison between AN and HC; **=p<.002 and *=p<.05 within group comparison between each post-prandial timepoint (T30, T60 and T120) and fasting (T0). Error bars represent standard error of the mean. F value represents between group comparisons (between AN, ARFID, and HC).