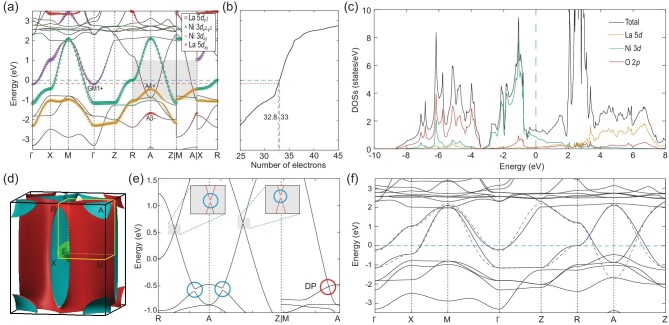
Figure 2.
(a) The band structure of LaNiO2 without SOC. The weights of the La  , Ni
, Ni  , Ni 3dxy and La 5dxy states are indicated by the size of the purple squares, green circles, yellow triangles and red diamonds, respectively. The La
  band at Γ is labeled GM1+, while the Ni 3dxy and La 5dxy bands at A are labeled A4+ and A3−, respectively. The blue dashed line represents the Fermi level EF and the red dashed line represents the estimated chemical potential in the hole-doped Nd0.8Sr0.2NiO2. The total number of electrons as a function of the chemical potential is plotted in (b). The partial density of states (DOSs) is given in (c). The Fermi surfaces of LaNiO2 are shown in (d). In the band structure with SOC (e), the crossings in the shadowed area of (a) are gapped except the Dirac point (DP) along M-A. The bands of our two-band model are shown as blue dashed lines in (f).

