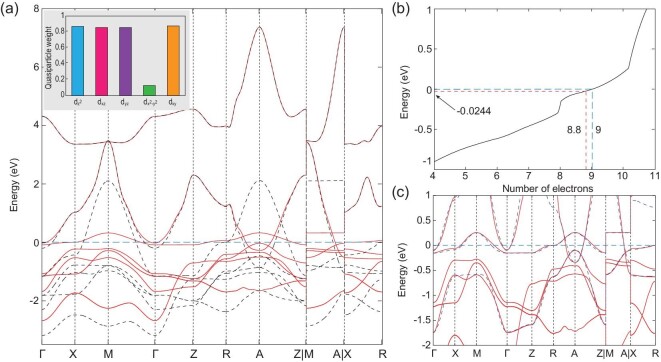
Figure 3.
(a) The band structure of the noninteracting tight-binding Hamiltonian Htb, extracted by the Wannier90 package, is given by black dashed lines, while the DFT+Gutzwiller bands are plotted in red solid lines. The inset of (a) shows the quasiparticle weights of five 3d orbitals. In panel (b) we show the total number of electrons as a function of the chemical potential in the DFT+Gutzwiller band structure. In panel (c), the bands of the three-band model are given by blue dashed lines.

