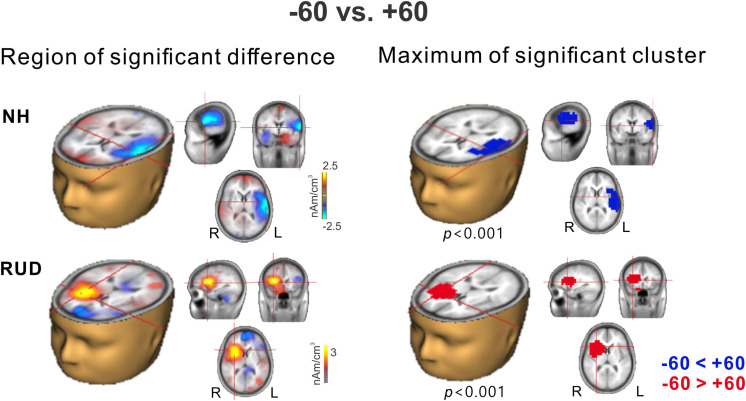
FIGURE 5.
Cluster data representing significant differences between –60° and +60° azimuth angles in the brain source space. Blue indicates that +60° was greater than –60° (a negative difference) while red indicates that –60° was greater than +60° (a positive difference). Note that these clusters indicate which regions showed a significant difference while the crosshairs indicate a 3D point indicating the maximum difference between the azimuth angles. RUD, right-sided unilaterally deaf; NH, normal hearing.

