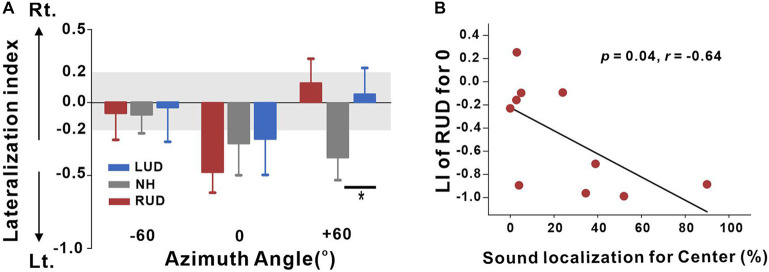
FIGURE 6.
(A) Lateralization index (LI) plots at –60°, 0° (center), and +60° azimuth angles for the RUD, LUD, and NH groups. The gray regions in the LI plots indicate a 0.2 criterion for laterality. (B) Significant negative correlations for the RUD group between percent correct values on sound localization task and LIs for the center. Error bars: standard error of the mean. *P < 0.05. RUD, right-sided unilaterally deaf; LUD, left-sided unilaterally deaf; NH, normal hearing.

