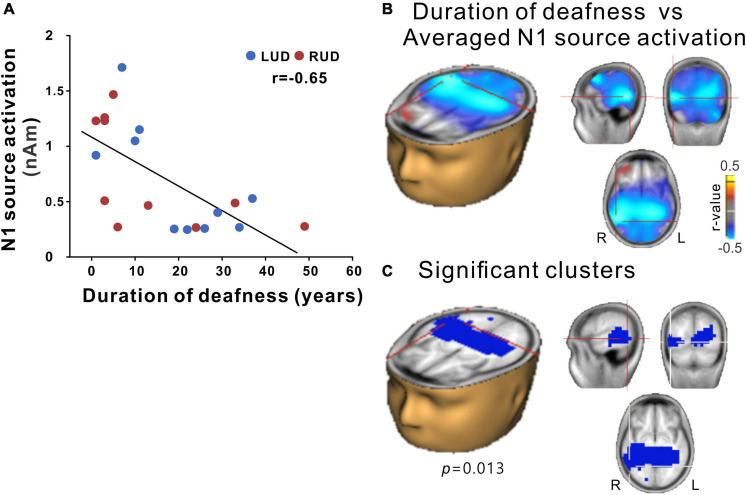
FIGURE 7.
(A) N1 source activation correlation with the duration of deafness. (B) Voxels representing correlations between the duration of deafness and the averaged N1 source activation across the RUD and LUD groups. (C) Correlation data for voxels with peak correlations (crosshairs). Note that significant clusters were found in a broad region of the brain encompassing the bilateral temporal and occipital lobes with lateralization in the right hemisphere. RUD, right-sided unilaterally deaf; LUD, left-sided unilaterally deaf.

