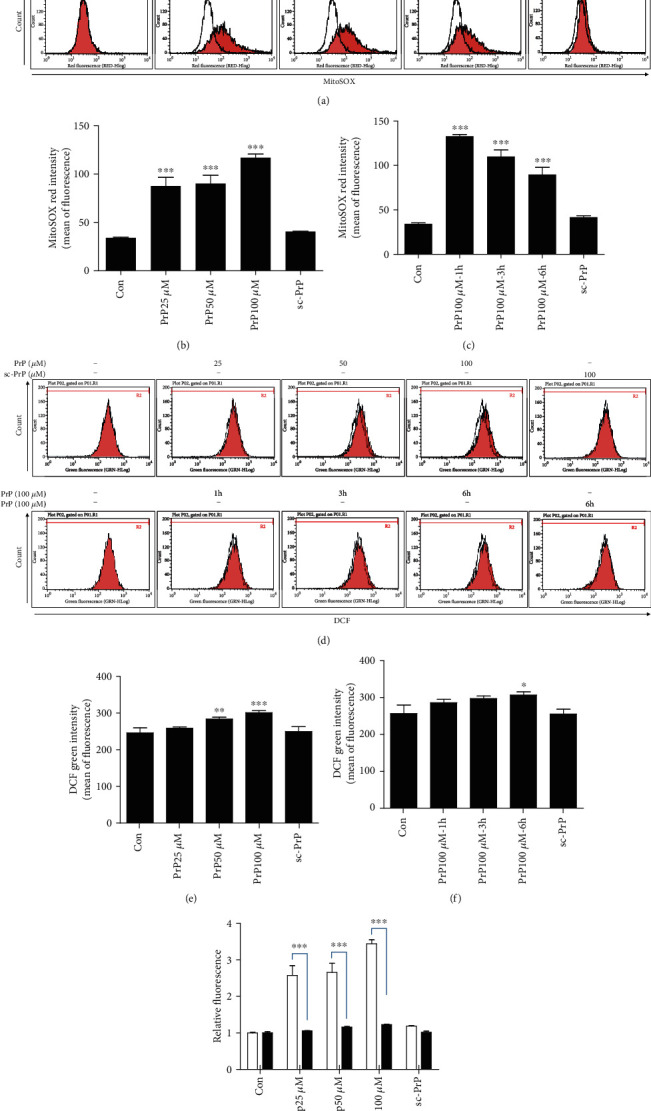
Figure 2.

PrP (106-126) increased superoxide more than hydrogen peroxide. (a) Neuroblastoma cells (SK-N-SH) were exposed to PrP (106-126) or scrambled PrP in a dose- and time-dependent manner. Mitochondrial ROS was evaluated by a MitoSOX assay. (b, c) Bar graph showing the averages of the red fluorescence (MitoSOX) in a PrP dose- and time-dependent manner, respectively. Values represent the mean ± SEM (n = 10). ∗∗∗p < 0.001 vs. control. (d) SK-N-SH cells were treated with PrP (106-126) or scrambled PrP in a dose- and time-dependent manner. Cytosol ROS was evaluated by a DCF assay. (e, f) Bar graph showing the averages of the green fluorescence (DCF) in a PrP dose- and time-dependent manner, respectively. (g) Relative MitoSOX and DCF fluorescence in a PrP dose-dependent manner. Values represent the mean ± SEM (n = 10). ∗p < 0.05, ∗∗p < 0.01, and ∗∗∗p < 0.001 vs. control.
