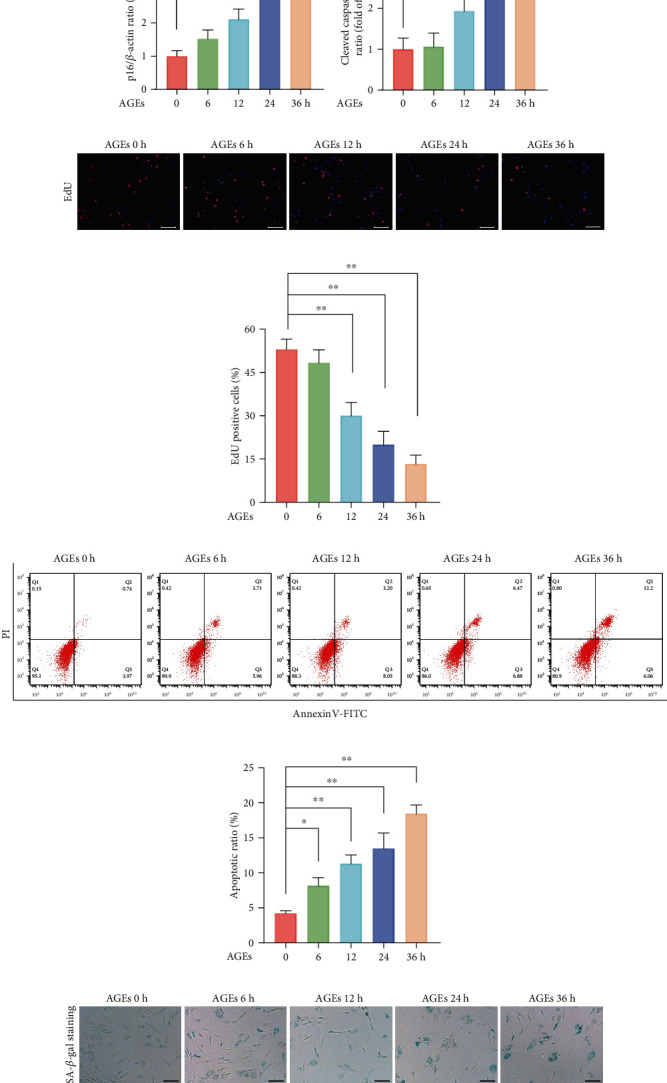
Figure 1.

AGEs treatment promoted senescence and apoptosis in human NP cells. The human NP cells were exposed to 200 μg/mL AGEs for different times (0, 6, 12, 24, and 36 h), and 0 h group served as the control. (a–d) Apoptosis and senescence-associated proteins p16, p53, and cleaved caspase 3 were measured using western blot assay, and relative band density was quantified. (e, f) Cell viability was determined using EdU staining combined with DAPI staining for the nuclei, and the positive cell ratio was quantitated, scale bar: 100 μm. (g, h) Representative dot plot images of flow cytometry analysis after labeled with Annexin V-FITC/PI double staining, both early and late apoptosis cells, were quantified. (i, j) Cell senescence was assessed by SA-β-gal staining; representative SA-β-gal staining images and positive cell ratio were illustrated, scale bar: 50 μm. Data are represented as mean ± SD. ∗∗P < 0.01, ∗P < 0.05.
