
Figure 3.
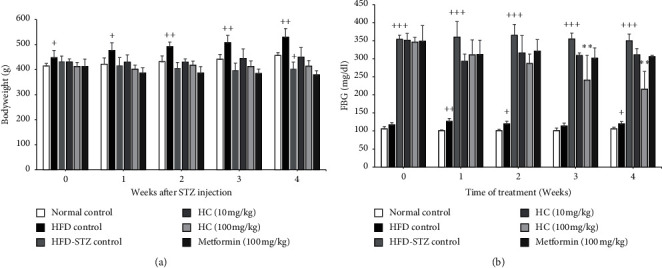
Effect of HC on rats' bodyweight and fasting blood glucose. (a) Weekly bodyweight and (b) fasting blood glucose (FBG) level of each group. +p < 0.05, ++p < 0.01, and +++p < 0.001 versus normal control group. ∗∗p < 0.0001 versus HFD-STZ control group. Results are presented as means ± SD (n = 6 each group).