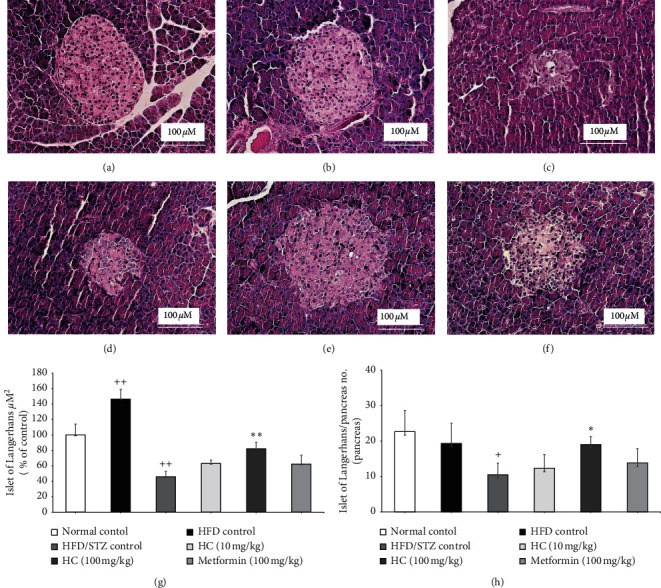
Figure 5.

Histological analysis of pancreatic tissue sections stained with H&E. (a) Normal control; (b) HFD control; (c) HFD-STZ control; (d) HC 10 mg/kg; (e) HC 100 mg/kg; (f) metformin; (g) Islet of Langerhans area; (h) Islet of Langerhans/pancreas number. Magnitude 40x. +p < 0.01 and ++p < 0.001 versus normal control group. ∗p < 0.05 and ∗∗p < 0.001 versus HFD-STZ control group. Results are presented as means ± SD (n = 6 each group).
