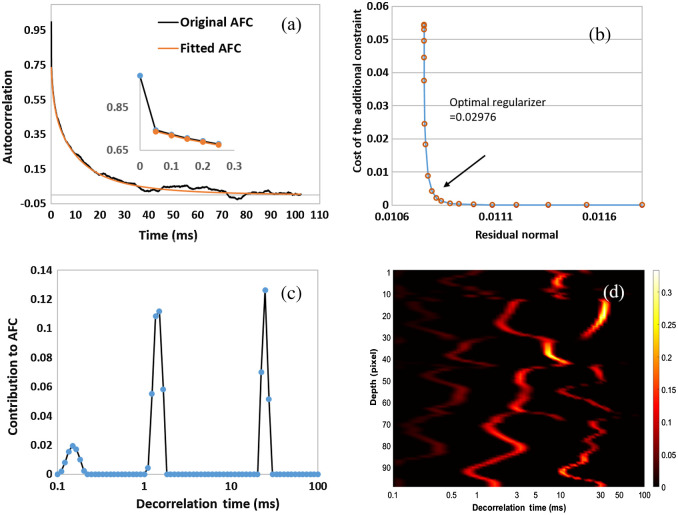
Fig. 3.
Autocorrelation analysis with the CONTIN method. (a) A typical AFC with IM and the recovered AFC with the DT peaks identified in (c) with the CONTIN method. (b) L curve employed to find the optimal regularizer from the AFC. (c) The DT derived from the AFC shown in (a) with the CONTIN method. (d) DT color map of 100 pixels with IM calculated with CONTIN method. The inset in (a) is the magnified AFC at time delay .

