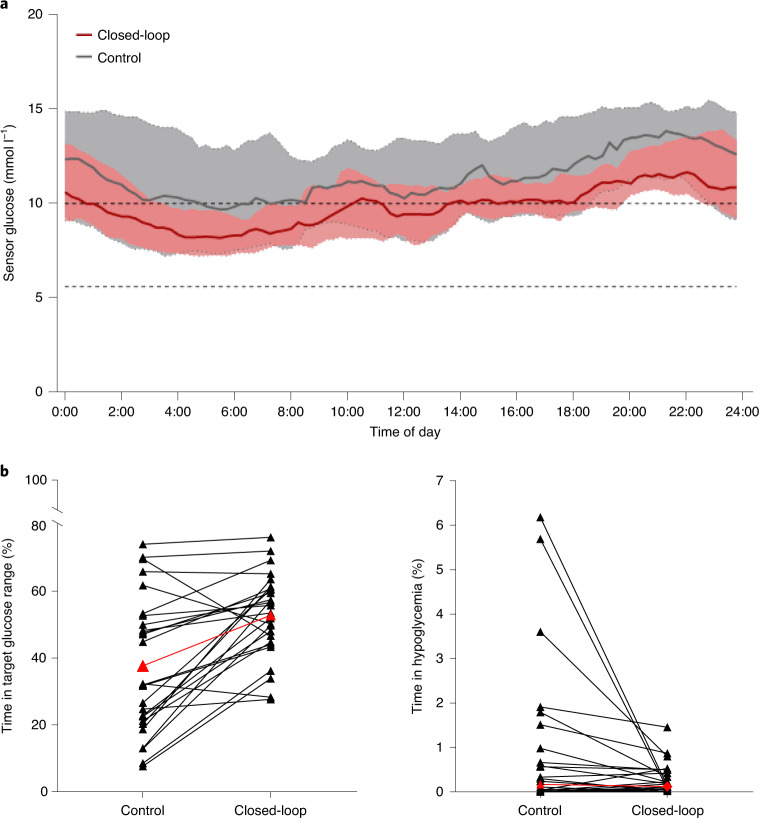
Fig. 2. Glycemic outcomes during closed-loop and control periods.
a, Median and IQR of sensor glucose during the closed-loop period (solid red line and pink shaded area) and control period (solid gray line and gray shaded area) from midnight to midnight. n = 26 biologically independent samples. The lower and upper limits of the glucose target range, 5.6–10.0 mmol l−1, are denoted by the horizontal dashed lines. b, Individual participants’ time spent with glucose in the target glucose range of 5.6–10.0 mmol l−1 (left; overall mean shown in red) and with glucose in hypoglycemia <3.9 mmol l−1 (right; overall median shown in red) during control and closed-loop therapy.

