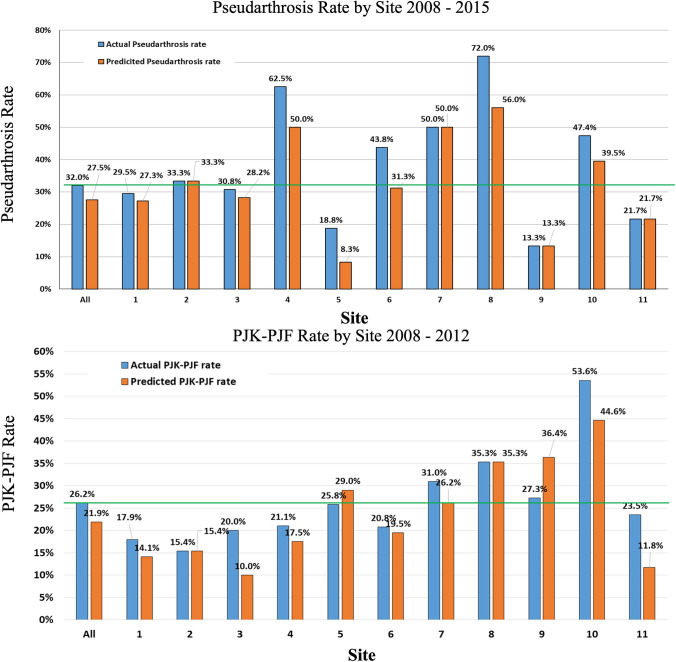
Fig. 4.
Using predictive modeling for pseudarthrosis and PJF-PJK performance benchmarking in patients with minimum 2-year follow-up. Actual rates for pseudarthrosis and PJF-PJK are compared to site-specific predicted rates. The green line indicates average overall complication rate across all sites. Even though sites may have rates higher than the overall average, it is important to consider their higher predicted rates as well. Several sites demonstrated actual rates below the overall average but were still shown to be underperforming based on their predicted rates, while a couple showed actual rates higher than the average but lower than their predicted rates indicating higher performance

