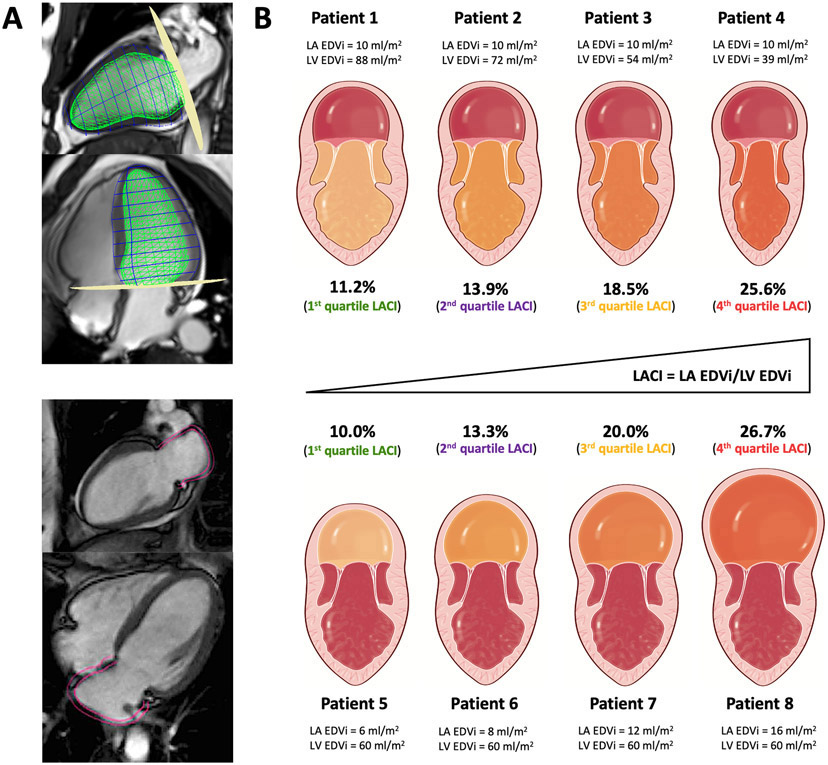
Figure 2. Schematic comparison of LACI variations in different subclinical pathophysiological settings.
Figure 2A illustrates the method to assess LACI by CMR defined by the ratio between the LA end-diastolic volume and the LV end-diastolic volume. A stack of short-axis cine images was acquired to encompass both ventricles and LV end-diastolic volume was measured using cardiac image modeler (CIM) software (green volume, top panel). LA end-diastolic volume was measured using multimodality tissue-tracking (MTT) software to track LA wall motion during the end-diastole (pink borders) in the 4-chamber and 2-chamber views (bottom panel).
In the Figure 2B, four patients from this cohort have the same normal value of LA EDVi (10 ml/m2) but different normal LV EDVi values (top panel), and four other patients with the same normal value of LV EDVi (60 ml/m2) but different normal LA EDVi values (bottom panel).
Although these values of LA EDVi or LV EDVi were identical, LACI increased significantly in all cases. These eight patients belonged to one of the LACI quartiles with significantly different risk levels of cardiovascular events which were not detected by the value of LA EDVi or LV EDVi alone. A higher LACI reflects a higher dysfunction of the left atrioventricular coupling defined by a subclinical dilation of LA compared to LV.
Abbreviations:
CMR: cardiovascular magnetic resonance; LA: left atrium; LACI: left atrioventricular coupling index; EDVi: end-diastolic volume indexed; LV: left ventricle.

