
Figure 5. Astrogliosis and microglial proliferation after GCI is not affected by GD3S deletion.
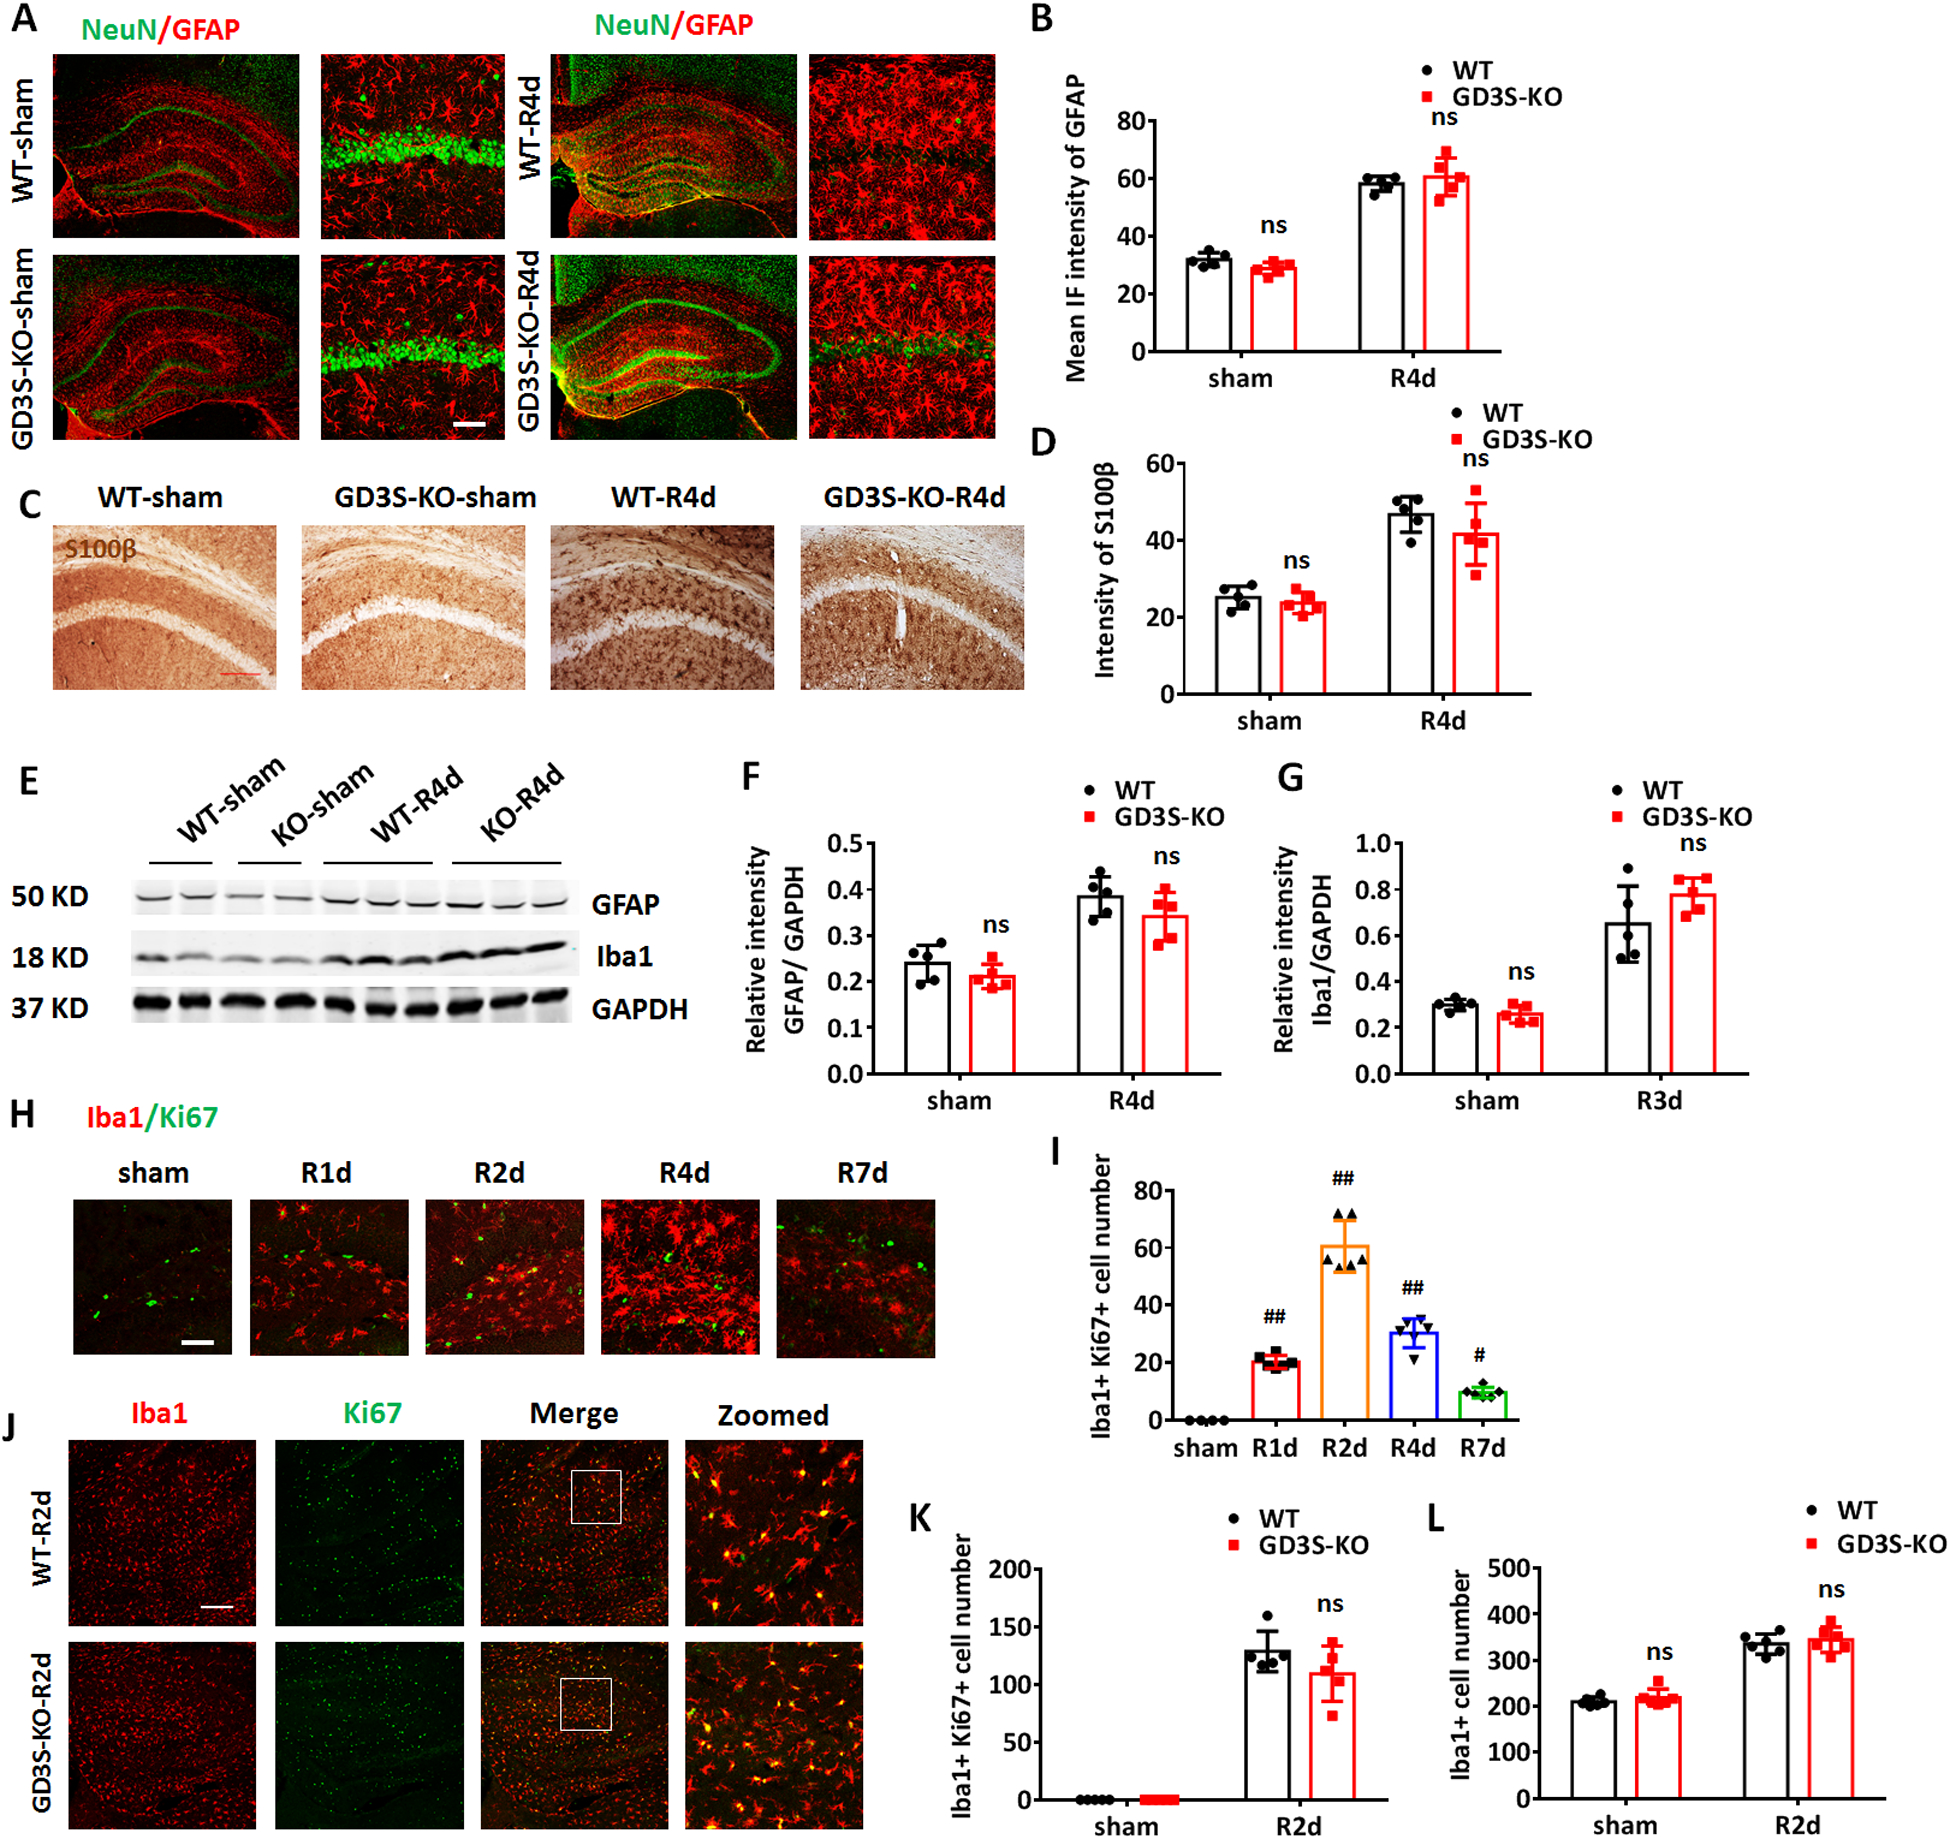
A. Representative images of co-immunostaining for NeuN (green) and GFAP (red) in the sham and GCI-R4d hippocampus and CA1. B. Quantifications of GFAP IF intensity in the hippocampus demonstrate no significant difference between WT and GD3S-KO both in sham and after GCI. C. Representative images of DAB staining for S100β in the hippocampal CA1 region. D. Quantification of the intensity of S100β demonstrates no significant difference between WT and GD3S-KO in sham and after GCI. E-G. Representative Western blots (E) and quantification of GFAP (F) and Iba1 (G) expression in the hippocampal tissue samples. H-I. Representative image of co-immunostaining for Iba1 and Ki67 (H) and quantification of Iba1+Ki67+ cell number (I) in WT hippocampal at different time points (R1d-R7d) after GCI (sham n=4 mice/group, GCI n=6 mice/group). J. Representative image of co-immunostaining for Iba1 and Ki67 in WT and GD3S-KO hippocampus at R2d. K-L. Quantification of Iba1+Ki67+ cell number (K) and Iba1+ cell number (L) demonstrates no significant difference between WT and GD3S-KO in sham and after GCI. n=5 mice/group except H and J. #p<0.05, ##p<0.01 compared with sham group, one-way ANOVA followed by post-hoc; ns. not significant, GD3S-KO vs WT. Two-way ANOVA followed by post-hoc. IF: Immunofluorescence. Scale bar: A and H, 20 μm; C and J, 50 μm.