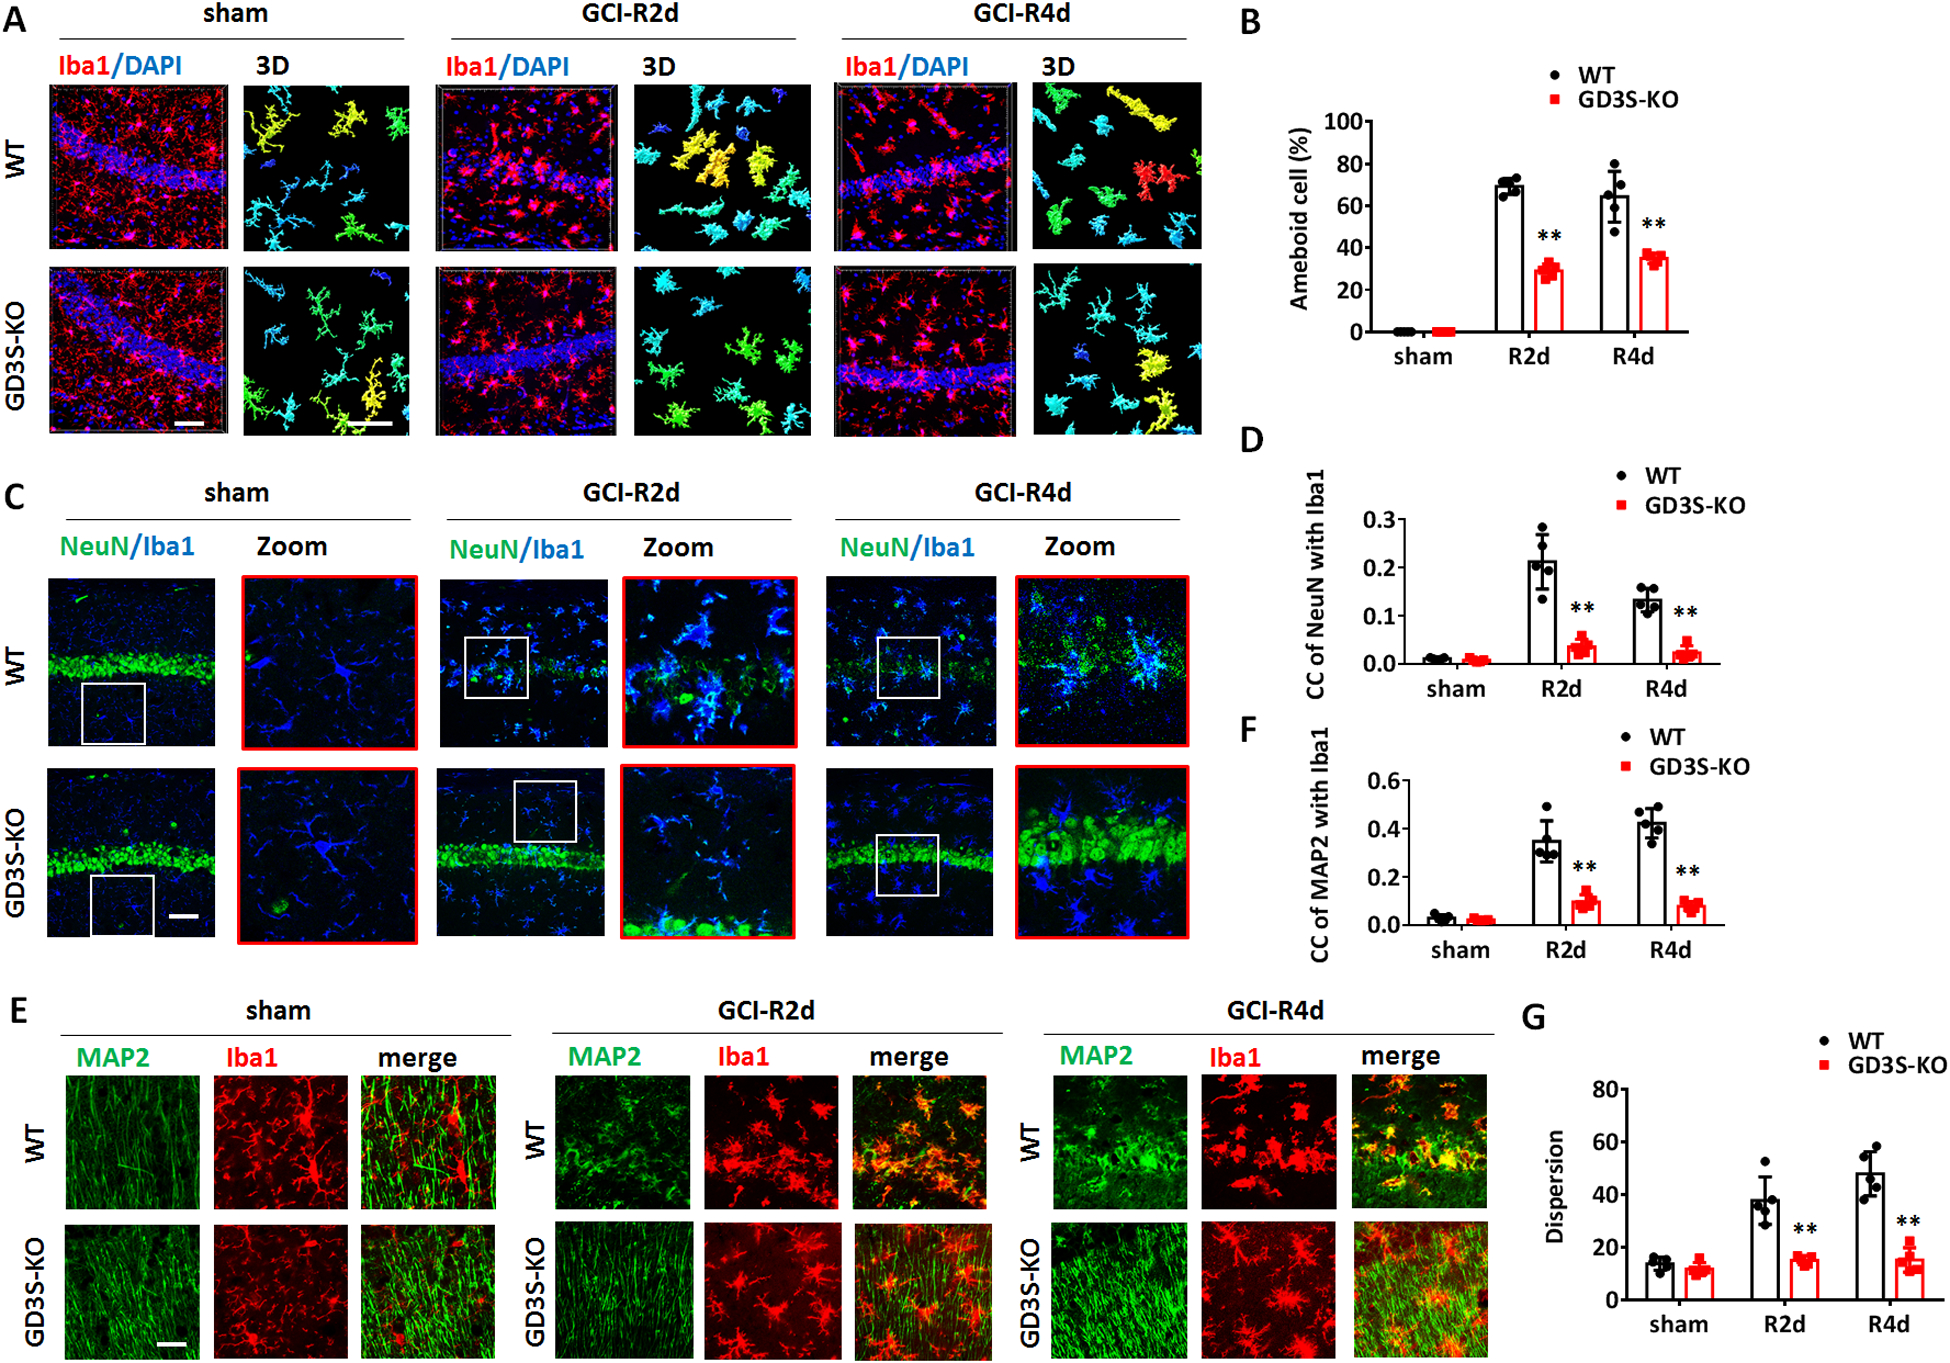
Figure 6. Decreased phagocytic microglia in GD3S-KO hippocampus after GCI.

A. Representative images of immunostaining for Iba1 in hippocampal CA1 region and 3-D reconstruction of con-focal images. B. Quantification of the percentage of amoeboid cell number in the hippocampal CA1 region according to Kreutzberg’s classification of microglia morphology. C-D. Representative images of immunostaining for NeuN and Iba1 in hippocampal CA1 (C) and confocal microscopy quantification of NeuN and Iba1 co-localization co-efficiency (D). E-F. Representative images of immunostaining for MAP2 and Iba1 in the hippocampal CA1 region (E), and confocal microscopy quantification of NeuN and Iba1 co-localization co-efficiency (F). G. Dispersion of MAP2 immunostaining was analyzed and quantified on the images of the hippocampal CA1 region by Image J software. n=5 mice/group. **p<0.01 compared with sham or control group. Two-way ANOVA followed by post-hoc. CC: co-localization co-efficiency. Scale bar: 20 μm.
